Stats
Regression
You can perform linear regression and logistic regression in AddMaple.To get started click the options menu and selection "Regression Analysis" 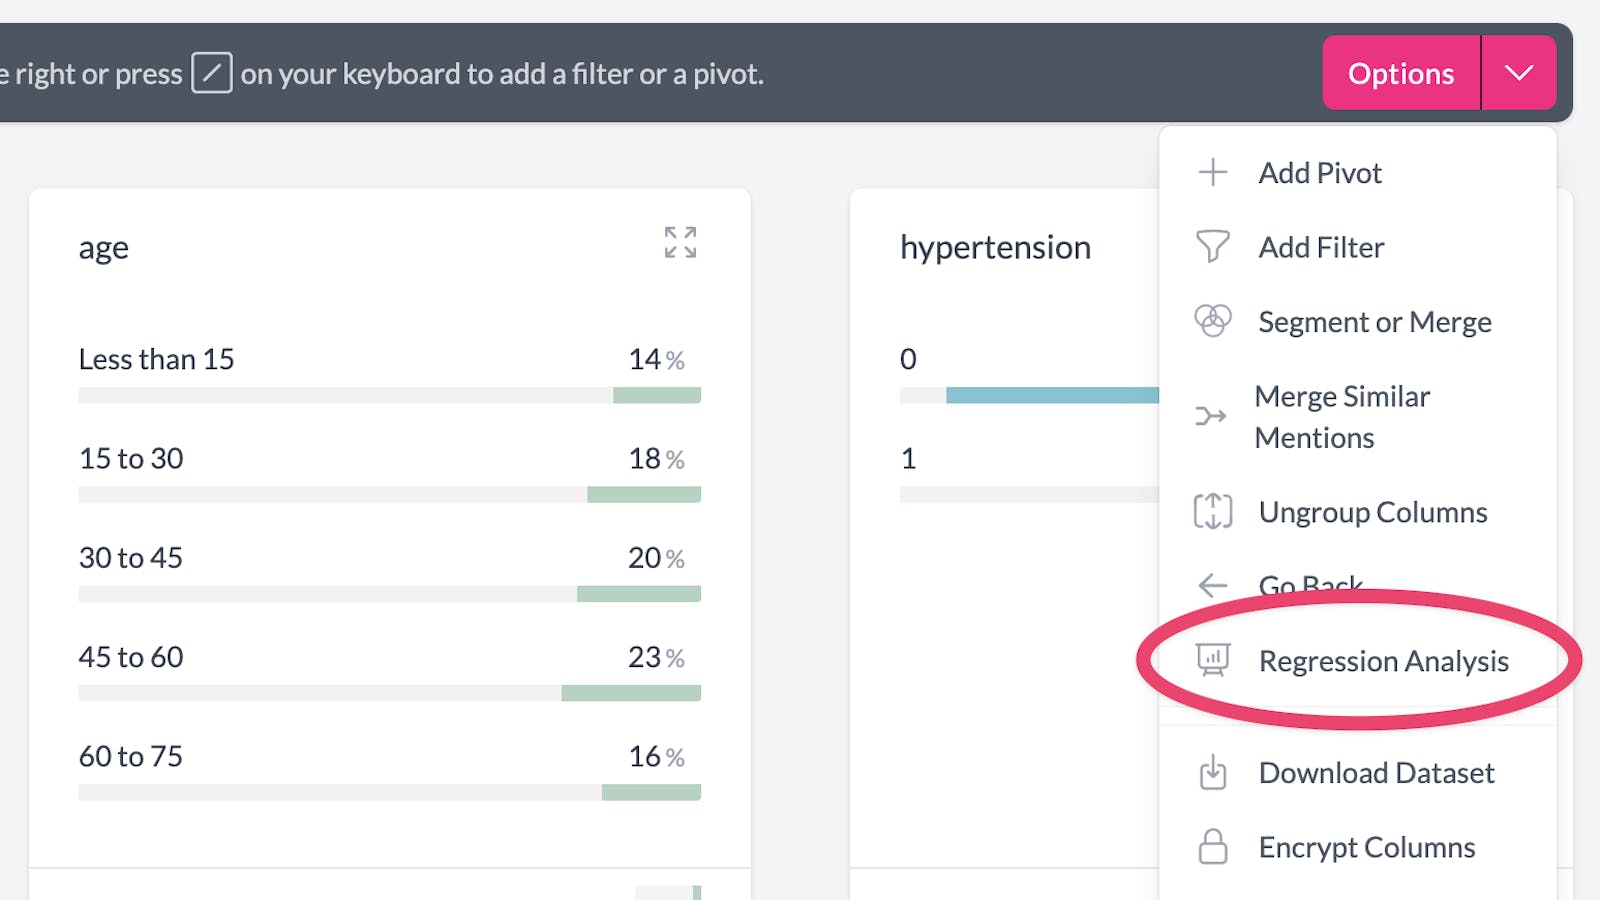
A pop up box will appear where you can choose the columns to perform the regression on. Currently we support linear and logistic regression between numeric columns and binary columns (either a boolean column or a multiple choice column with 2 categories).
We are planning to add support for multivariate regression soon. 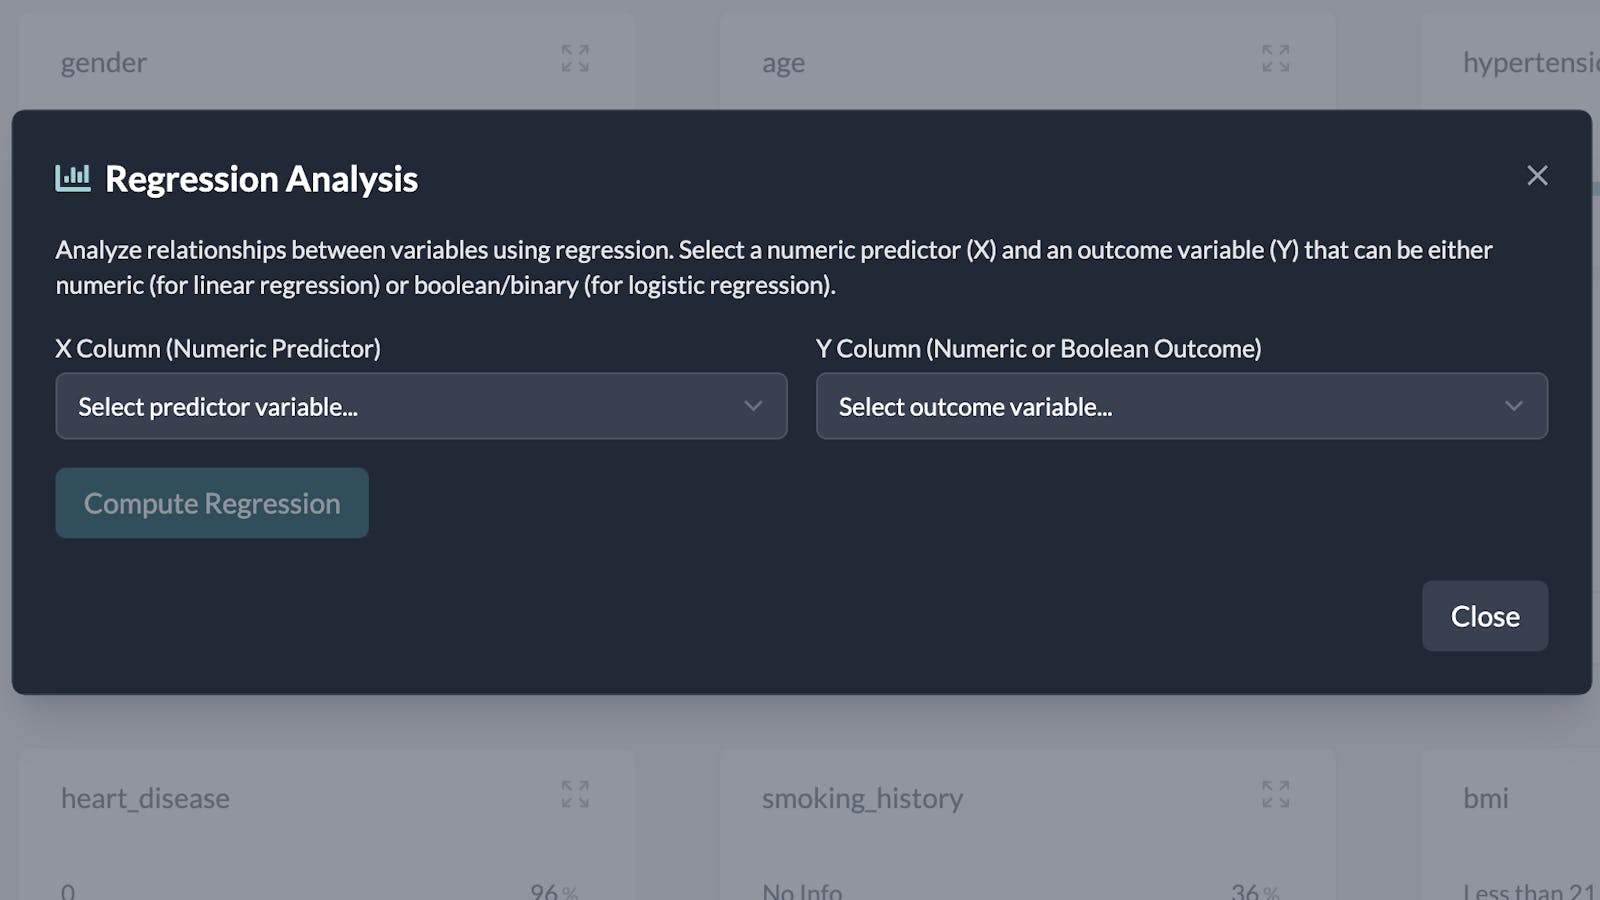
If you select 2 numeric columns and click Compute Regression, AddMaple will performa linear regression. The results of the linear regression are shown together with an interpretation. 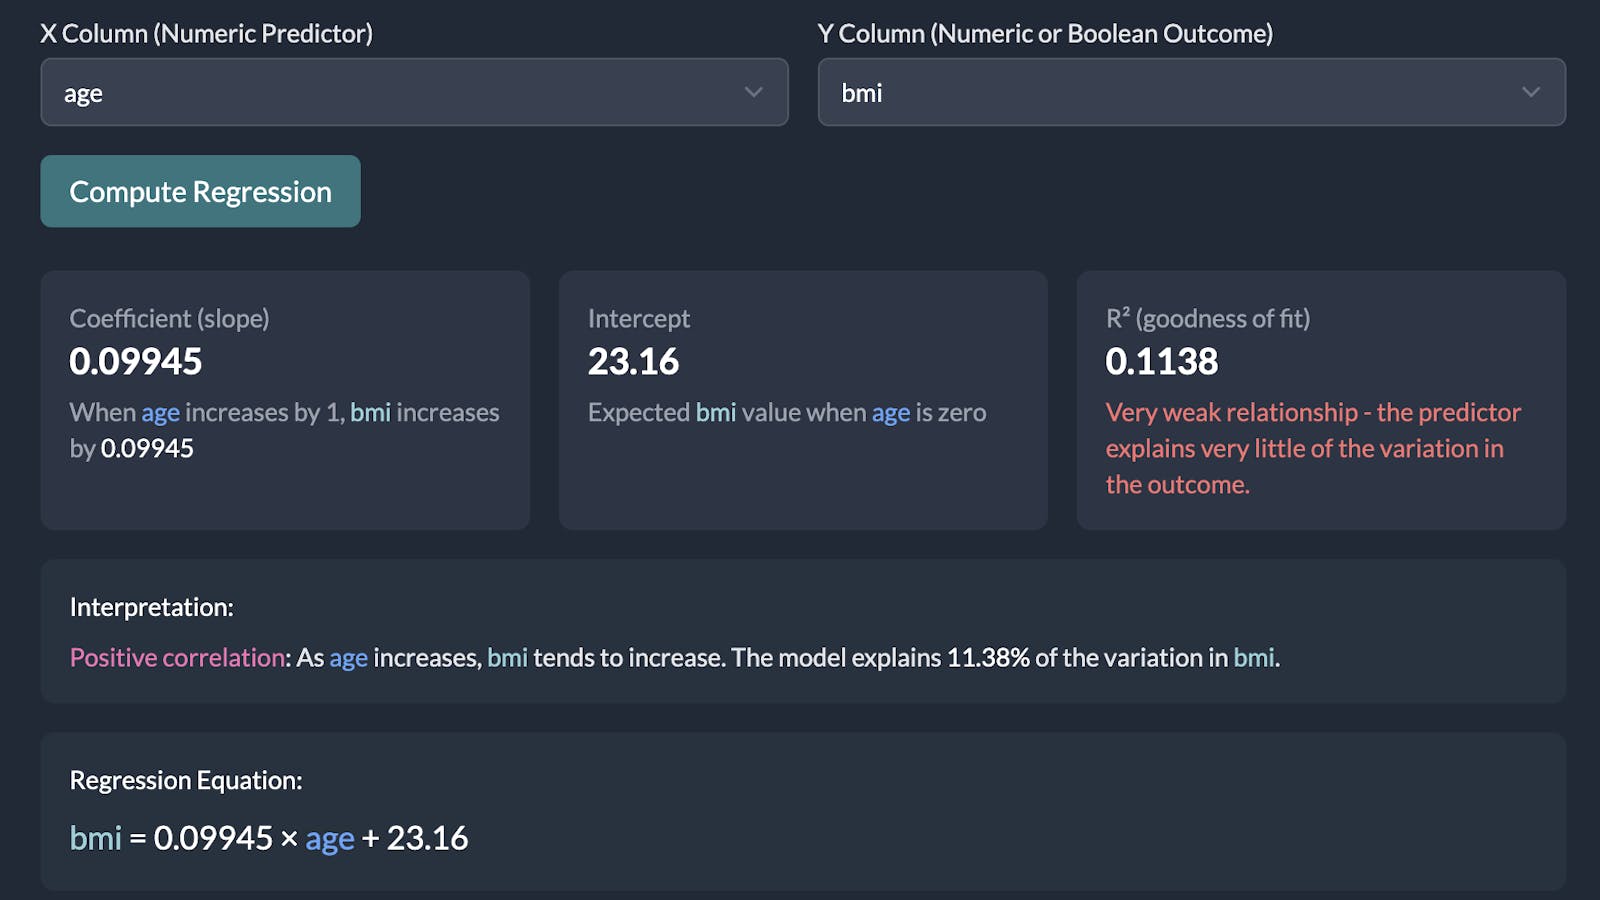
Below the numeric results you will find a scatter plot with the line of regression. 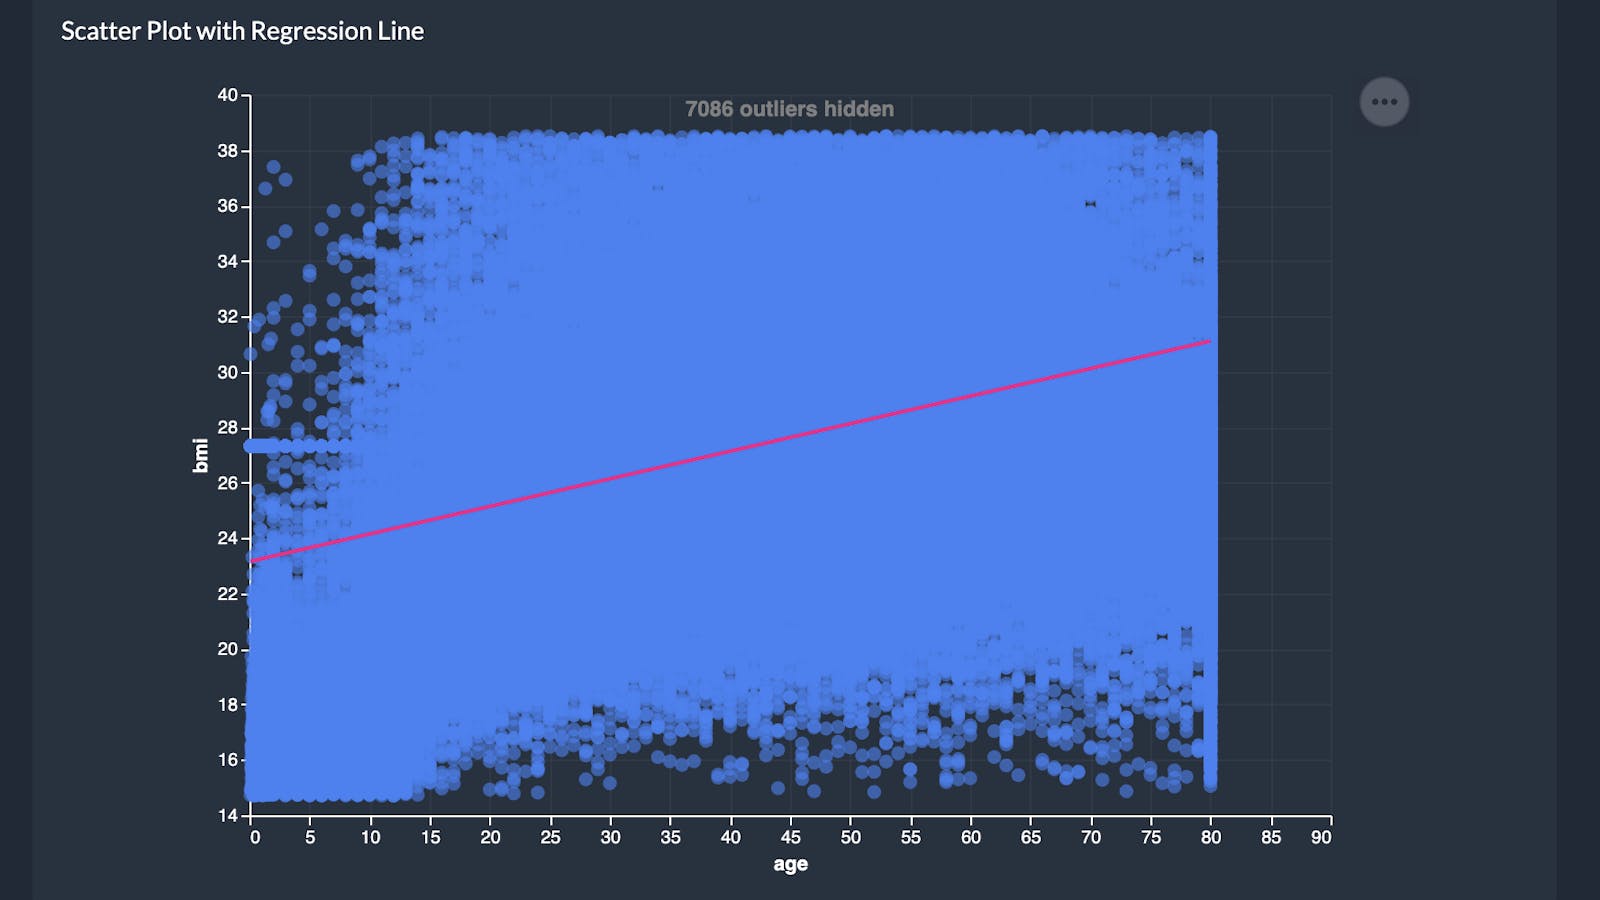
By default AddMaple will hide outliers. You can toggle them on to view the full dataset. 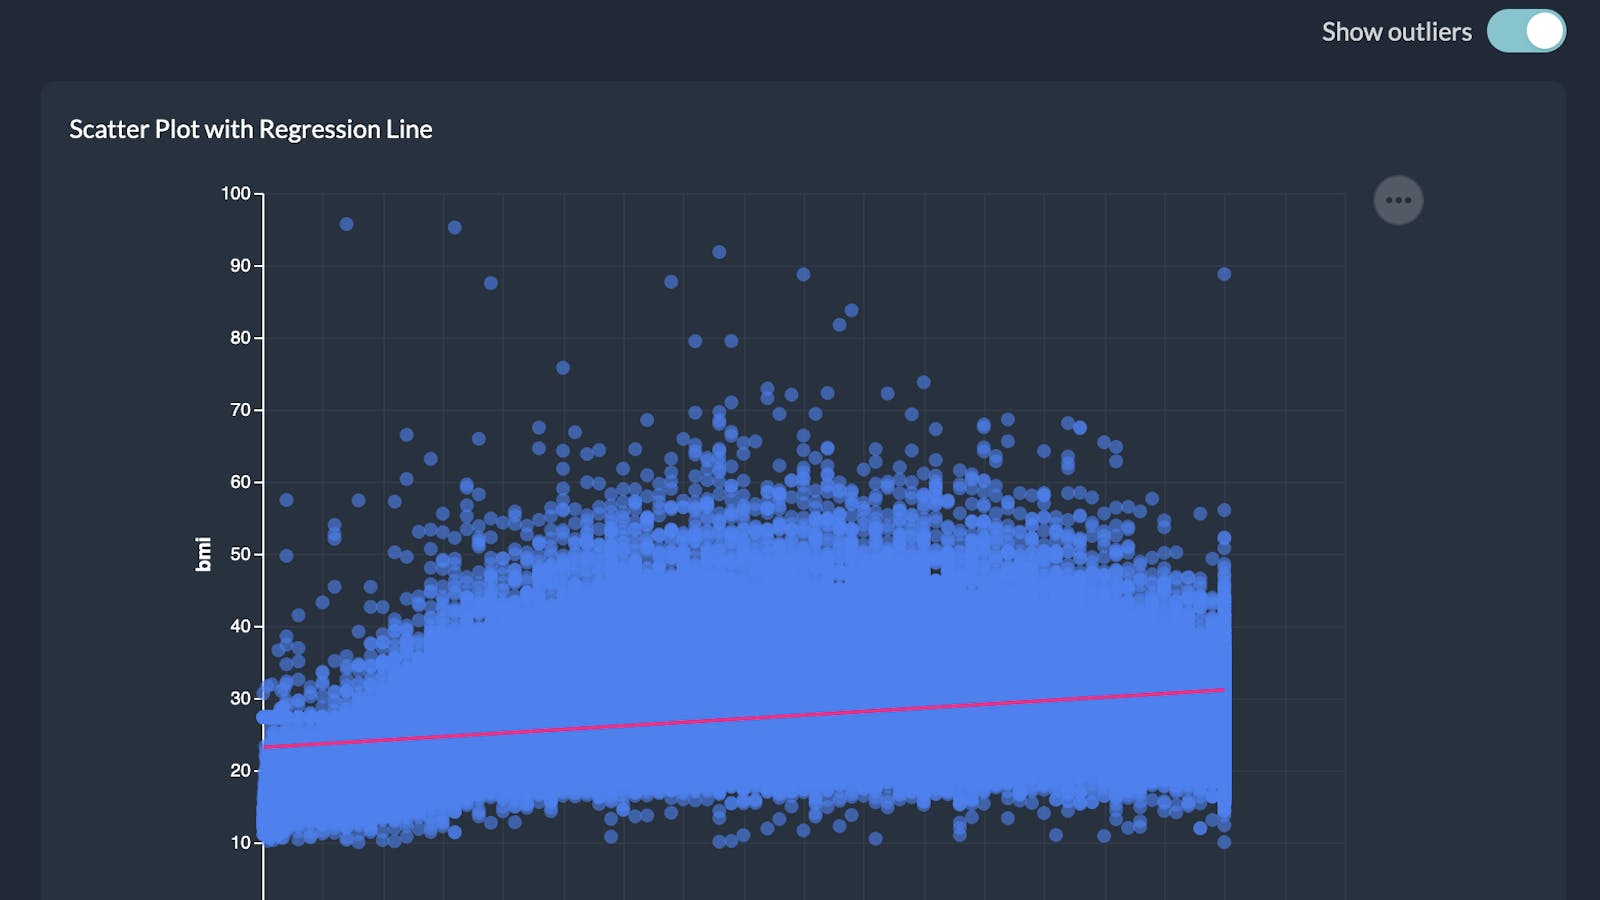
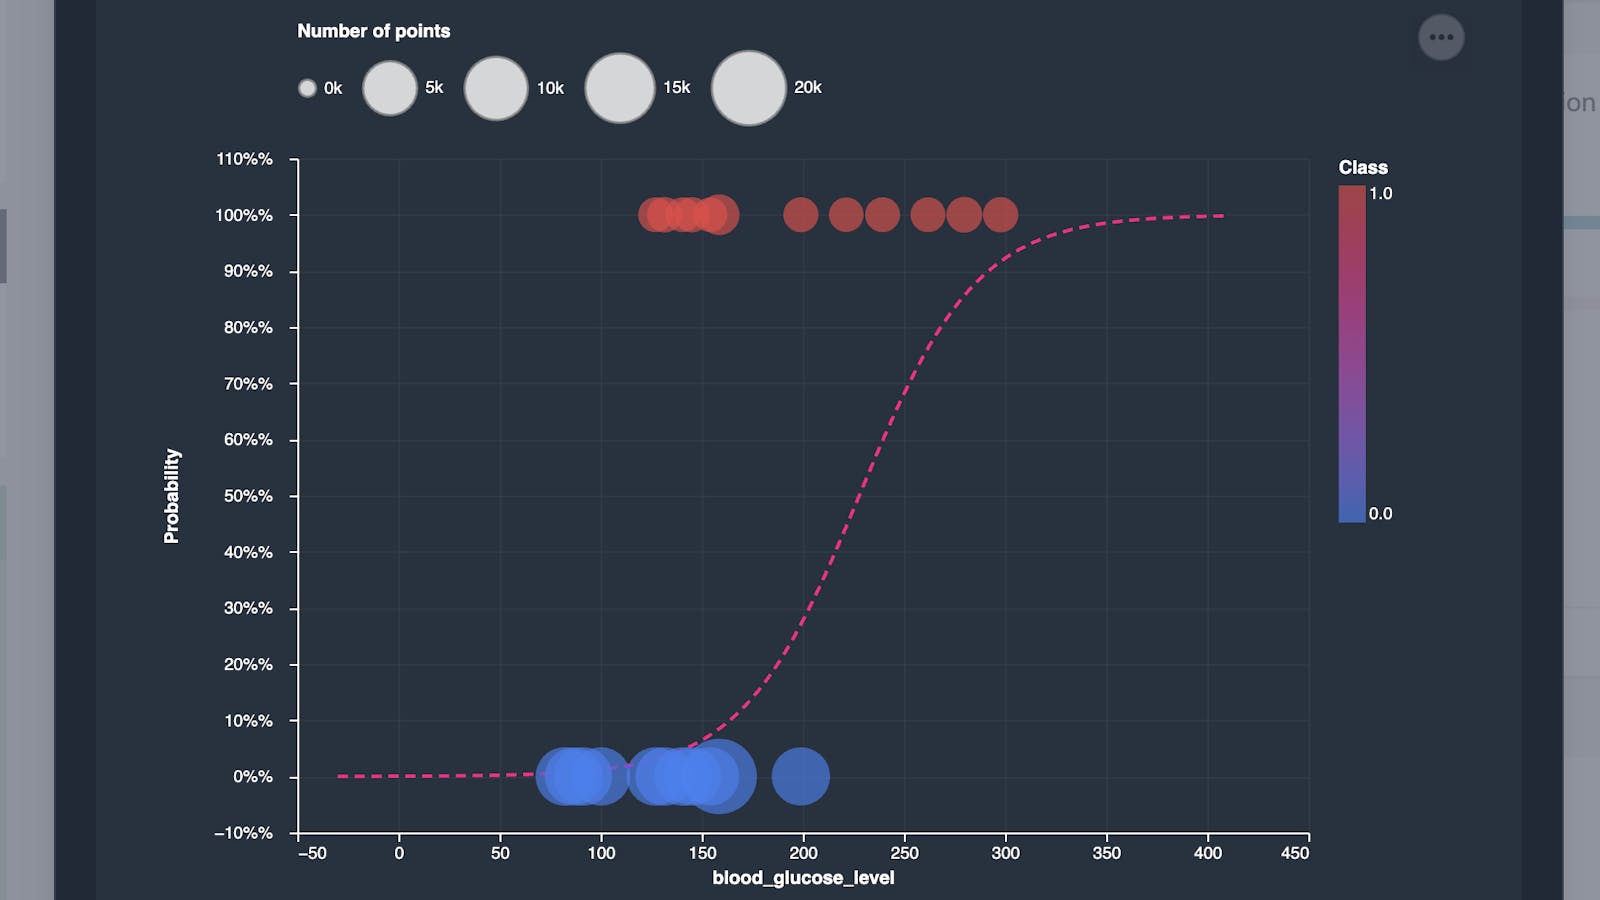
To perform a logistic regression, select a numeric column and a binary column (either a boolean or a multiple choice column with 2 categories).
AddMaple will show you the Log Odds Ratio, Intercept and Pseudo R-Squared results, along with an interpretation. 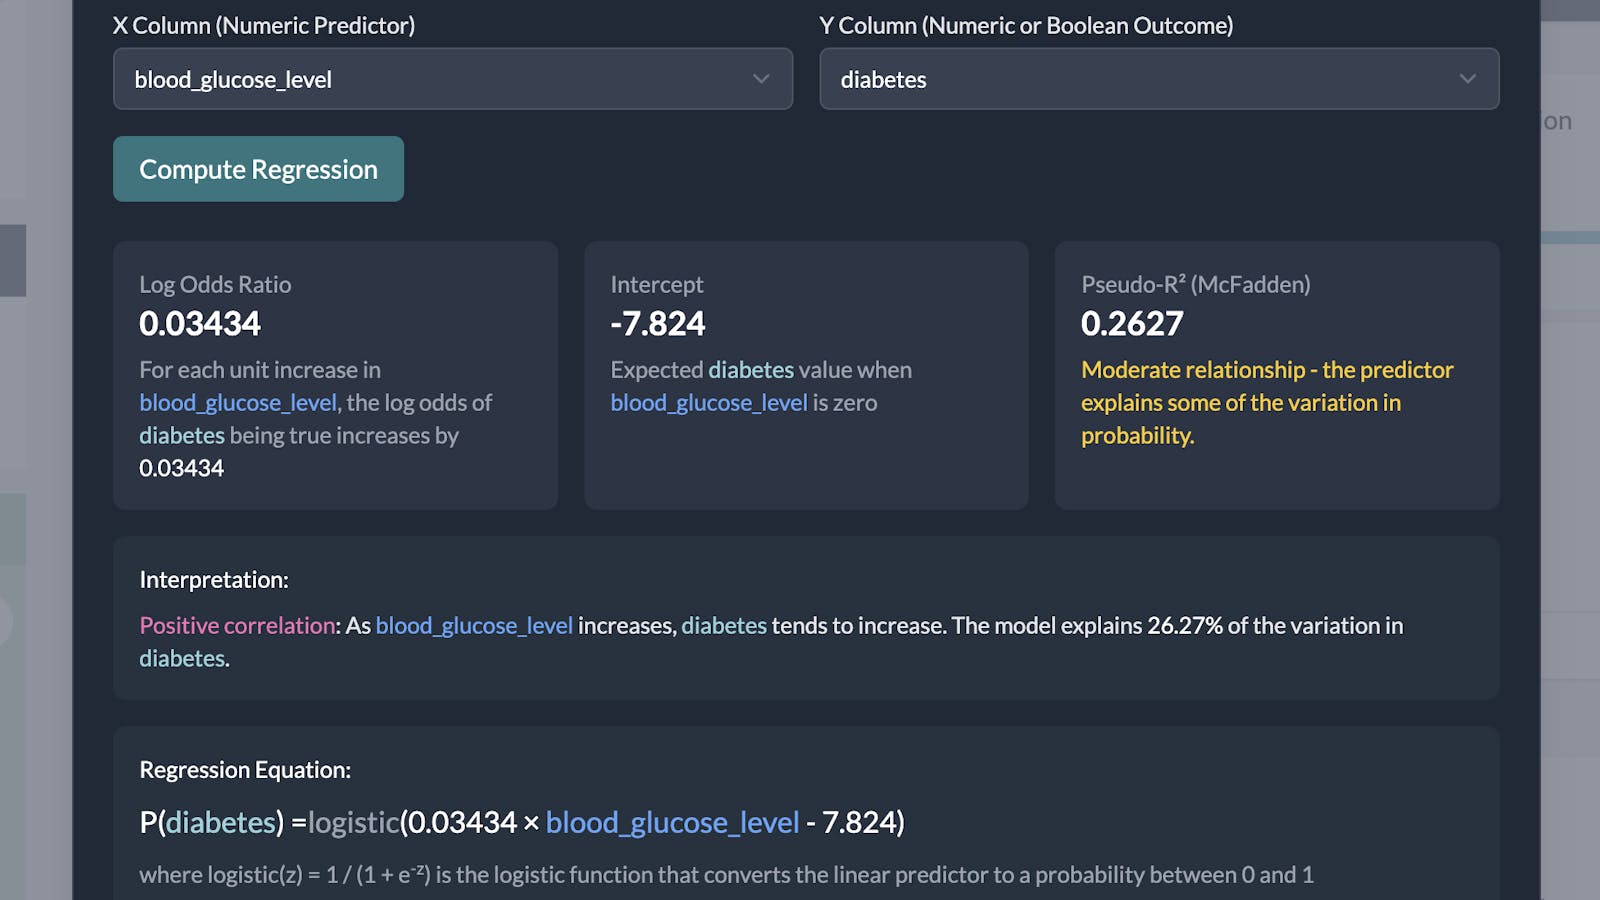
Below the results there will be a chart showing the regression curve.