
Export charts to PowerPoint
AddMaple exports selected charts and tables as editable PowerPoint slides — with your project colours, titles, and statistical footers. Export from My Collection or directly from a chart.
For brand colours on exports, see Agency branding for client exports.
What you can export
- Charts and tables only — not text blocks, images, or other dashboard item types
- Slides follow your project's colour settings when you use project-wide presets (see Colors)
- When a weight column is applied, exports include weighted results (see Weighting)
Option 1: Download from My Collection
- Open My Collection from the project navigation
- Click items to select them — preview thumbnails appear when available
- In the actions bar at the bottom, click Download as PowerPoint
See Using My Collection.
You can also add selected items to a dashboard from the same actions bar (Add to Dashboard).
Option 2: Download from a chart
While viewing a chart:
- Open the chart actions menu
- Choose Download as PowerPoint
- Configure the slide in the preview, then download the
.pptxfile
See Share and Export Insights.
Configure slides before download
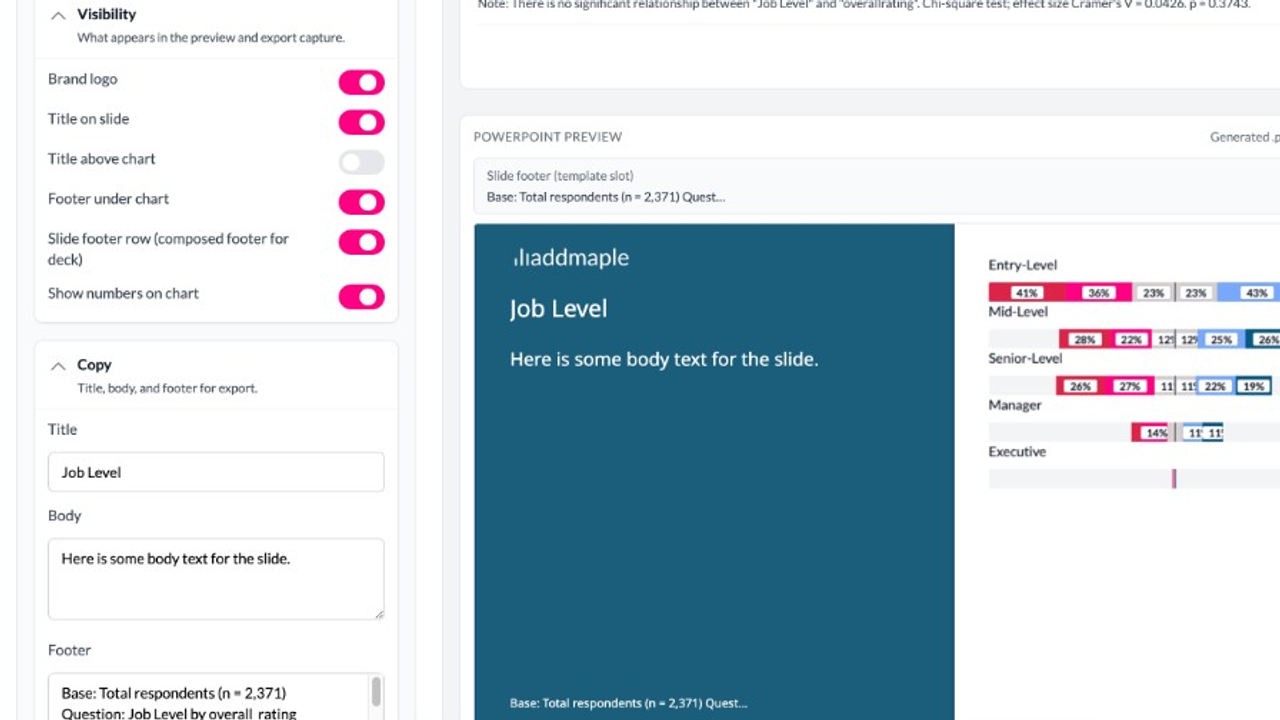
The PowerPoint preview shows exactly how each slide will look. Before downloading, you can:
- Toggle brand logo, title, footer, and numbers on the chart
- Edit title and body copy on the slide
- Review the statistical footer (base size, question text, and test notes)
Charts use the same evidence as your analysis — re-export when the underlying cut changes instead of rebuilding slides manually.
Brand colours on exports
If you set project-wide colours in Settings → Project Settings, PowerPoint exports follow the chosen preset.
Steps from the colours guide:
- From the Explore Dashboard, open More menu → Settings → Project Settings
- Under Colors, select a preset (or define a custom palette)
- Click Save
All charts in the project update (except those with locked column-specific colours). PowerPoint exports will also follow the chosen preset.
See How to apply colour presets.
Deck plus Insight Hub
Many teams export a PowerPoint for the live presentation and publish an Insight Hub for ongoing access. See What is an Insight Hub?.