Key Drivers & Statistical Relationships
Identify key drivers and explore the relationships in your data with our automated stats engine.
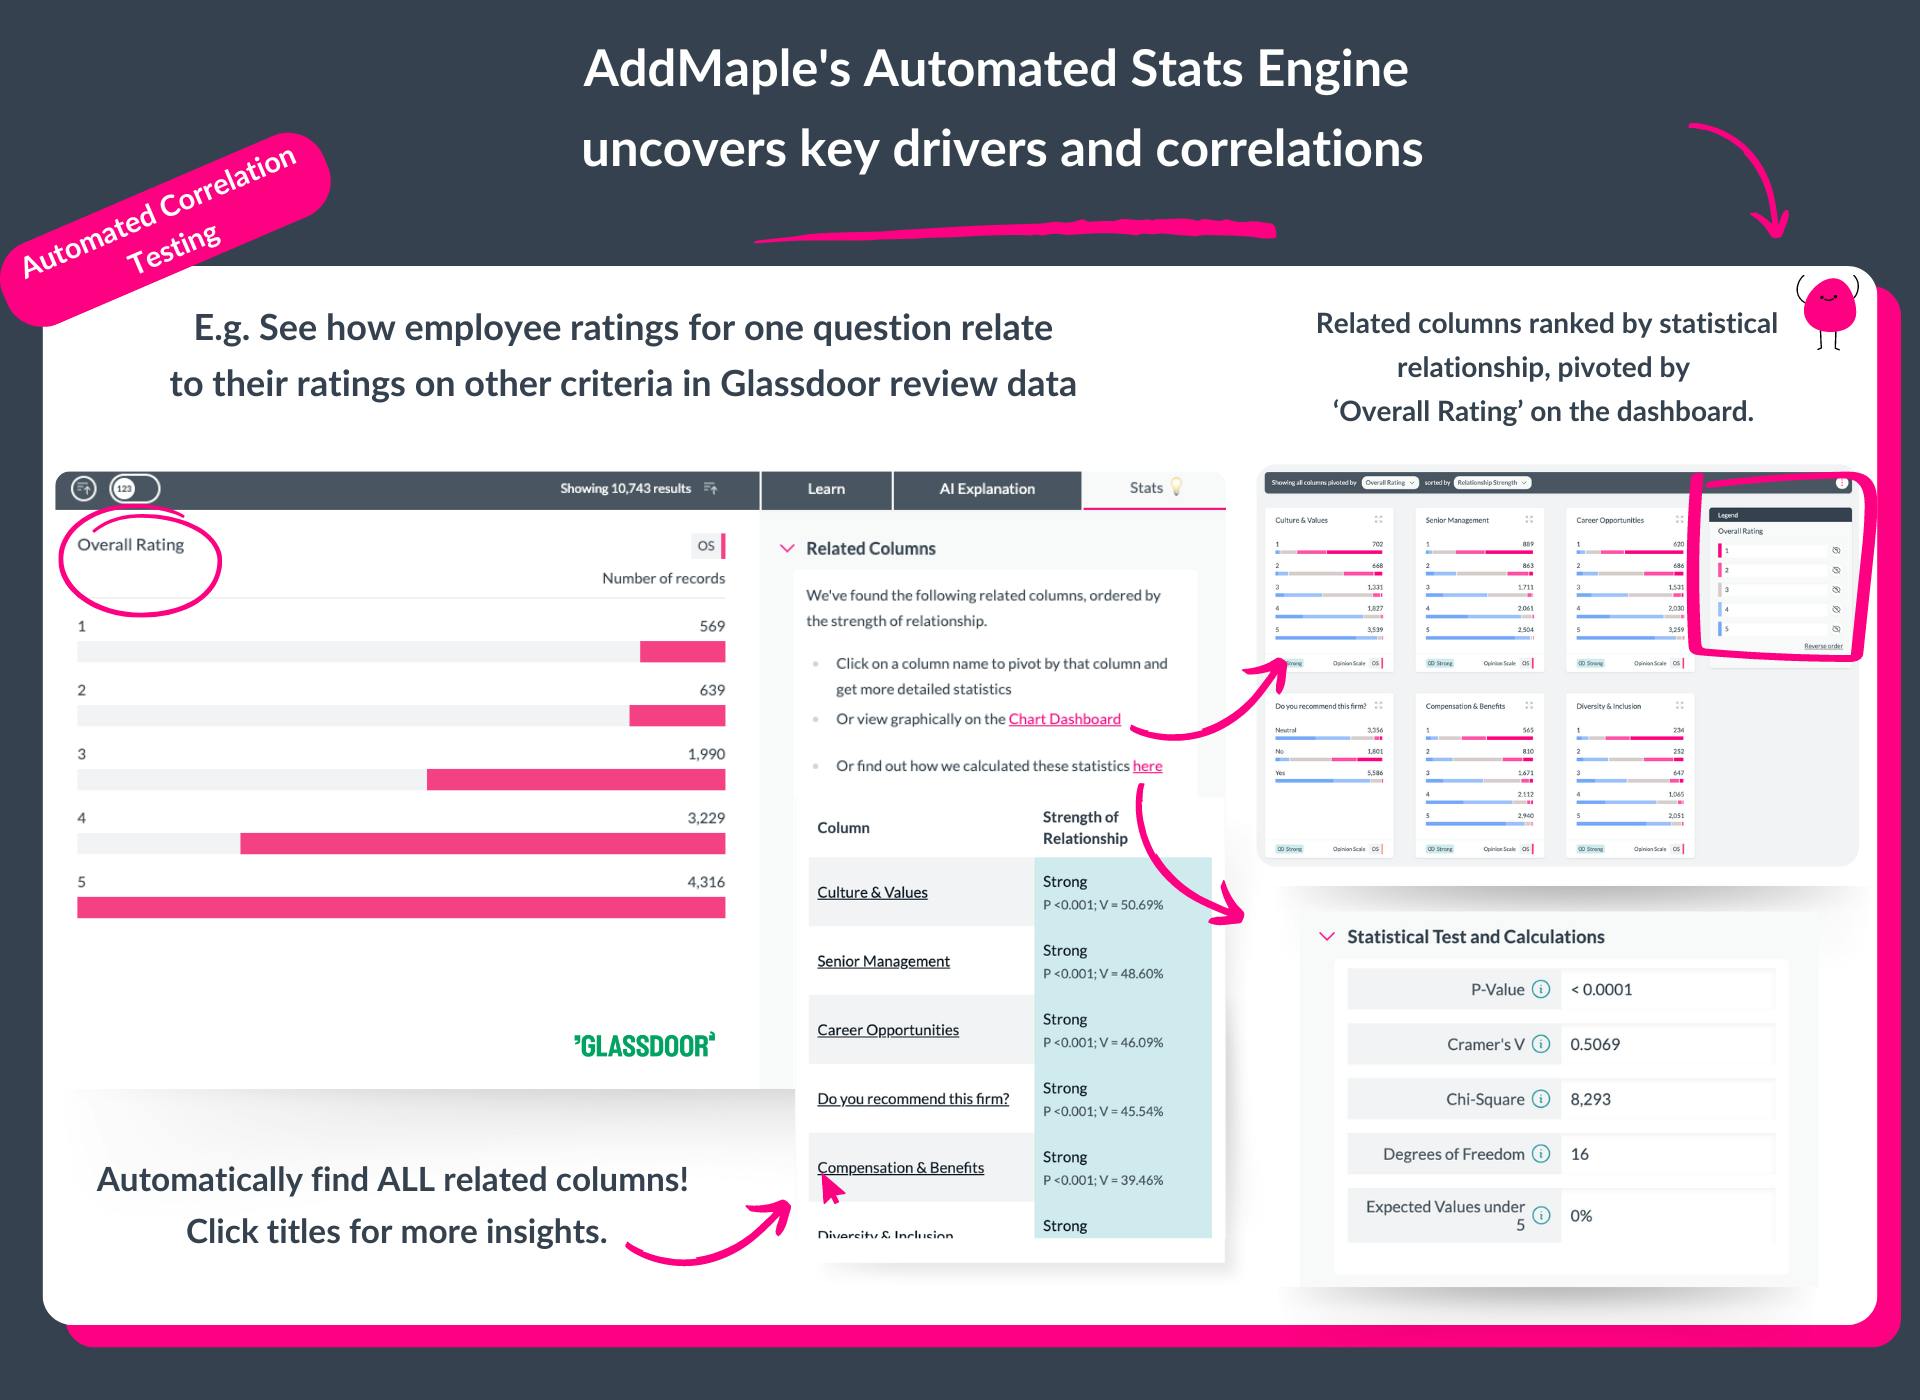
AddMaple automates statistical analysis, pinpointing significant connections between data columns without manual pivots or individual tests. Our algorithms instantly reveal and rank the strongest correlations, so you can confidently explore key relationships in your data.
Our Stats Engine AUTOMATICALLY performs:
-
**Descriptive Statistics: **Get the median, mean, standard deviation, sum, count and more for numeric data. For categorical data, get the average count of categories (useful for multi-select), total records per category etc.
-
Statistical Relationship Analysis: Discover associations between columns ranked by strength, regardless of data type. We analyze both numeric and categorical data using T-Test, ANOVA, Chi-Square, Pearson, and Spearman correlation tests.
-
In-Depth Category-Level Analysis: We identify which categories within your columns are significantly different from the rest by conducting post-hoc analysis, including Tukey's HSD and additional Chi-Square tests at the category level.
-
**Detailed Test with Results: **Expand to view the specific type of tests conducted and the detailed results, giving you full transparency and control over your analysis.
Feature Highlights
Ranked Relationships
Discover and explore the strongest associations between data columns, ranked by significance.
Instant Statistical Insights
Automatically get descriptive stats and the results of significance tests.
Visual Exploration
AddMaple's visual interface makes it easy to see and explore statistical relationships