Pivots & Crosstabs
Explore your data visually with our pivot charts and crosstabs
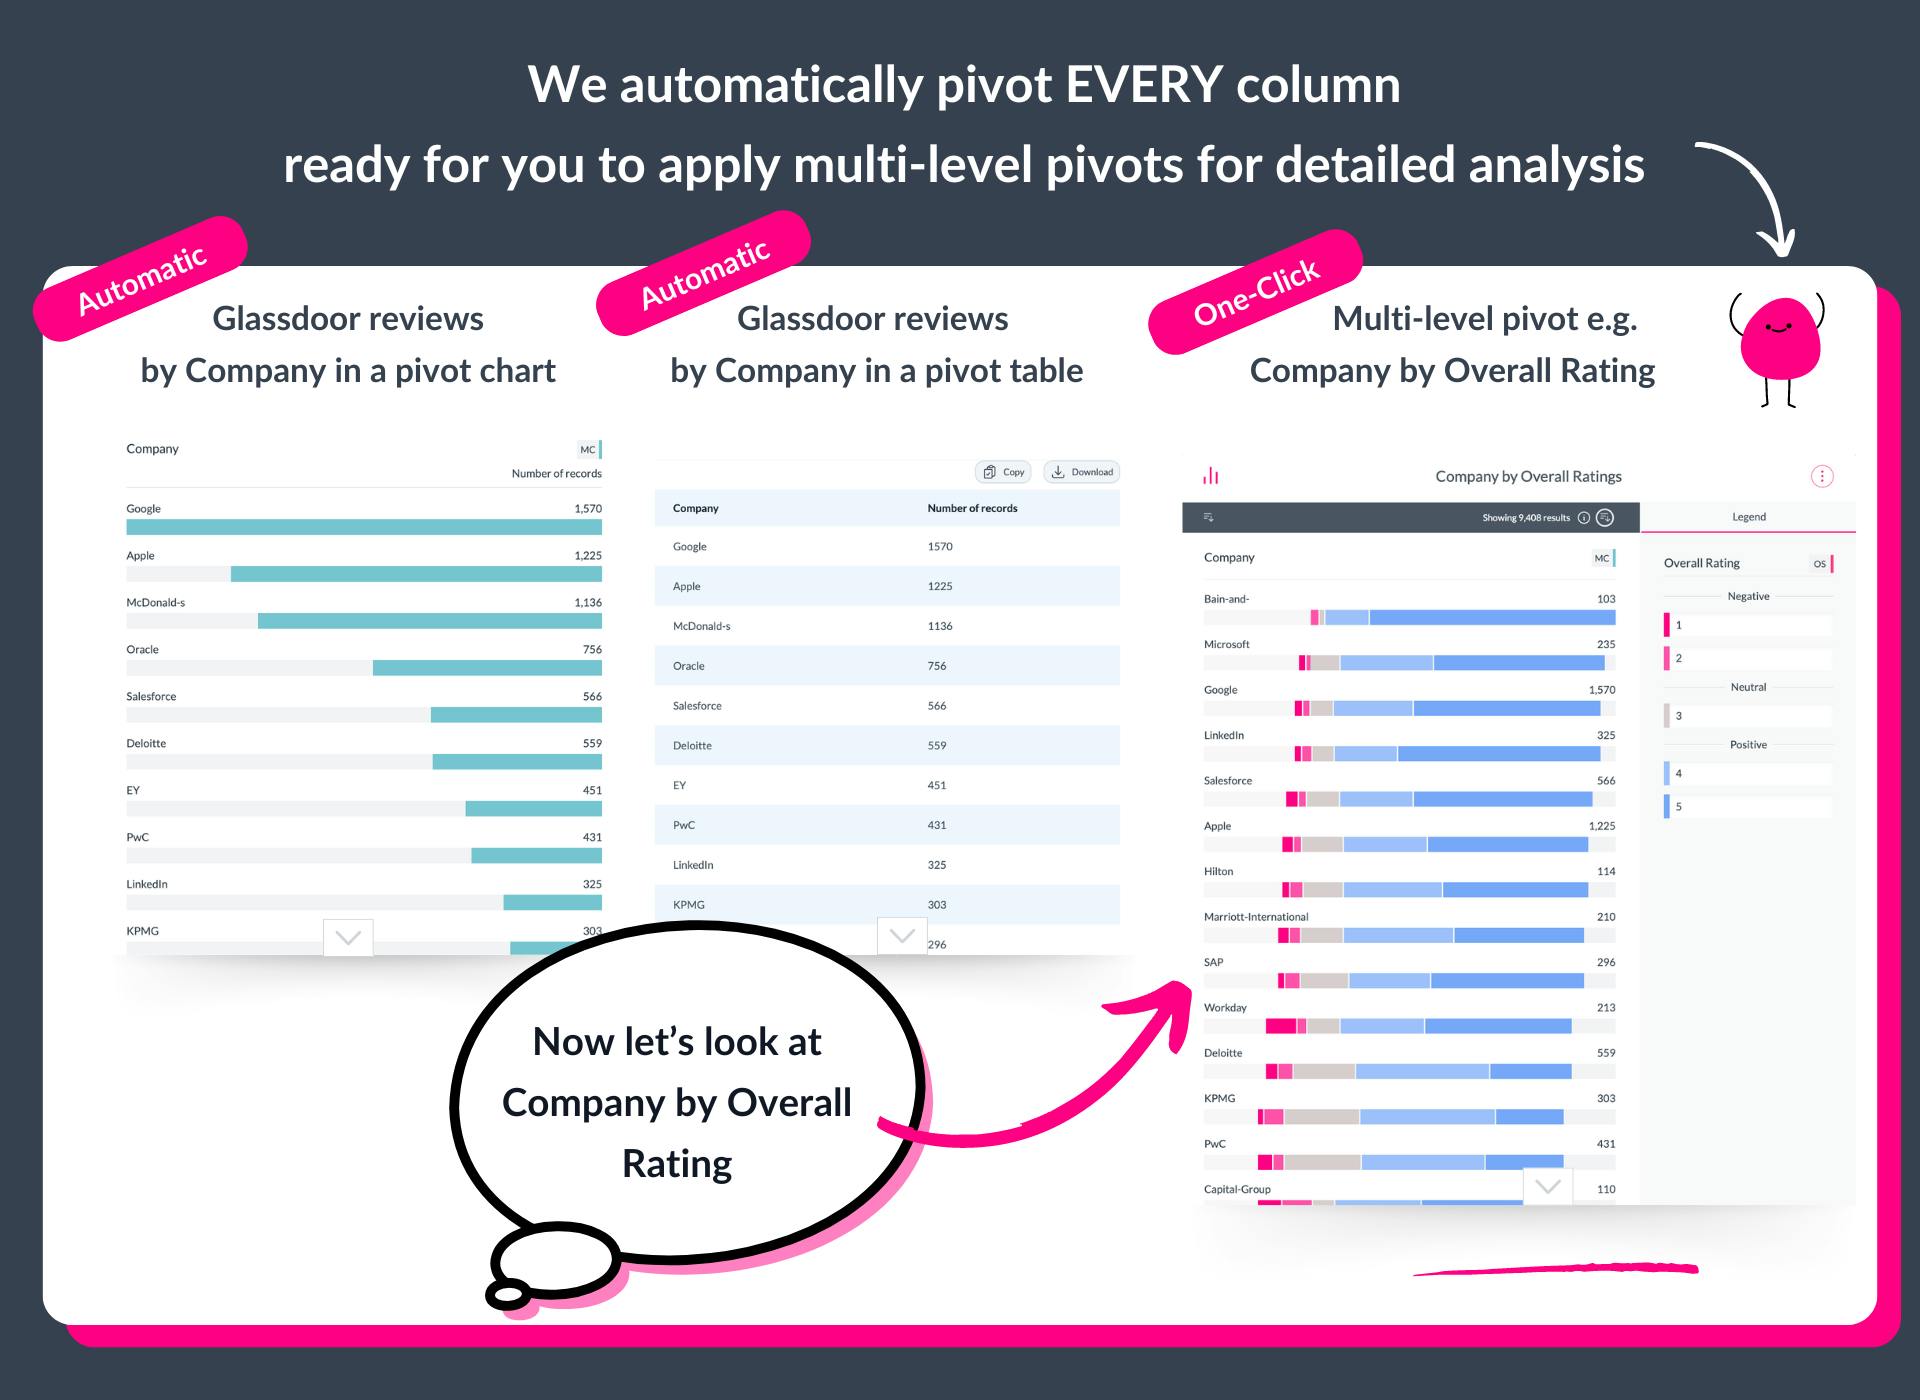
The easiest way to pivot and cross-tab one, two or more columns for advanced analysis
-
Begin with already-pivoted columns: AddMaple cleans and summarizes by data type
-
Pivot diverse data types: numeric, categorical, opinion ratings, dates and more can all be pivoted across other types of data in a click
-
Pivot multiple columns: Click to add additional columns and swap to adjust the pivot hierarchy
-
Aggregate by numeric columns: See the median rating received for culture by company name, see the average options selected in multi-select data across records, apply weighted data, see total sales by representative etc
-
Toggle between charts and tables: All columns are summarized into charts and tables, including multi-level pivots and cross tabs
-
See correlation between columns: We reveal all related columns ordered by significance, ready for you to explore in a click
Feature Highlights
Instant Cross Tabs
Easily create and explore cross tabs and pivot charts across all your columns
Multi-Data Support
Pivot numeric, categorical, date, and rating data across other types with just a click.
Aggregation
Aggregate data by numeric columns, like median ratings or total sales