Add Maple

Simplifying Exploratory Data Analysis

Exploratory Data Analysis (EDA) is an important step in the data analysis process, allowing researchers and analysts to make sense of raw data, uncover patterns, and formulate hypotheses. However, EDA can be time-consuming and complex, particularly when dealing with large datasets or diverse data types.

AddMaple reimagines the EDA process by providing a visual-first, zero-configuration interactive data dashboard. We clean and organize your data in a moment,  letting you go from a data file to insights in seconds.  Our aim is to enable you to focus on gaining insights rather than getting bogged down in data processing and setup. Whether you're working with CSV files, complex categorical data, or large datasets, AddMaple’s intuitive interface makes data exploration accessible, efficient and even fun.

Explorable Data Dashboard
Bar Chart

Visual-First, Code-Free Exploration

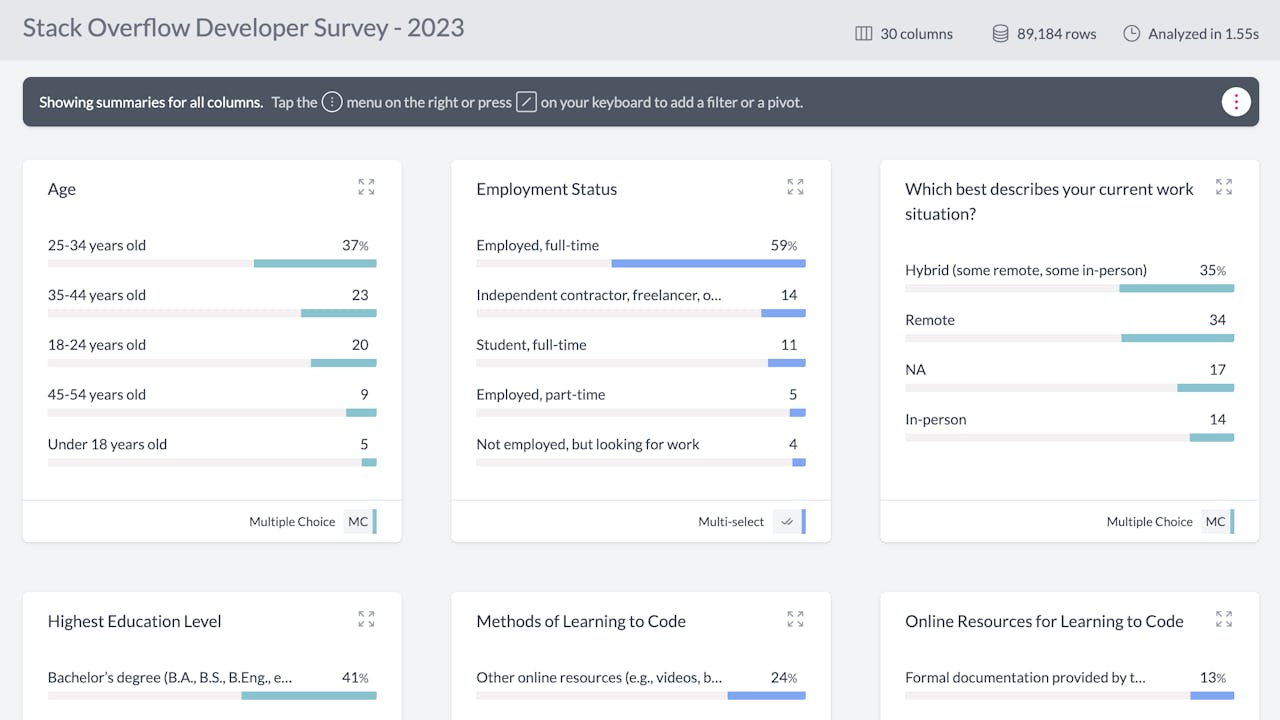
AddMaple's visual-first approach allows users to dive into data analysis without the need to write complex code or formulas. This makes it an excellent starting point for exploring data, especially for those who may not be proficient in programming. With AddMaple, you can swiftly explore various columns and identify relationships in your data through interactive visualizations. Add pivots, segment or get AI-generated summaries.

Speed and Ease of Use

AddMaple has been designed from the ground up to be fast, really fast. For datasets of up to 500MB the data is efficiently loaded into memory on your own system. We have a custom columnar data structure designed for instant pivoting and filtering. The speed of AddMaple doesn’t just make EDA faster, but enables users to experiment with different combinations and relationships far quicker than a code or formula driven approach. The product is also intuitive and easy to use with our zero-configuration instant data dashboards.

Complementing R & Python

While powerful tools like Python and R offer extensive capabilities for data analysis, they often require substantial coding knowledge and can be time-consuming for certain types of exploratory data analysis. This is where AddMaple steps in as a complementary tool, or even an alternative in some scenarios. In situations where in-depth, custom analysis is needed, these programming tools are invaluable. However, for quick data exploration, especially in the early stages of analysis, AddMaple can be a faster way to get from dataset to insights.  get a more efficient choice. Furthermore, insights gained from AddMaple can guide more targeted analysis in Python or R.

Bar Chart

AddMaple offers flexibility - it can be the main tool for quick, visual explorations, or part of a larger toolkit including Python and R, depending on the complexity and requirements of the analysis. This flexibility makes it a valuable asset in your toolkit, catering to a range of needs from basic explorations to complex investigations.

AddMaple offers a powerful yet accessible solution for exploratory data analysis. Whether you are a seasoned data scientist or a business professional, AddMaple equips you with the tools to explore and understand your data more deeply. From surveys, to analytics data, to search queries, to CRM data, to database exports - AddMaple can be an invaluable tool for EDA.

Bar Chart

Intuitive Visualization

AddMaple transforms complex datasets into easy-to-understand visual formats, aiding in the quick identification of patterns and trends in the data.

Rapid Data Sorting and Filtering

Users can effortlessly sort and filter data, allowing for a speedy examination of different data aspects without the need for complex queries or programming.

AI-Powered Insights

AddMaple leverages advanced AI to automate data cleaning, organization, and visualization. Our system excels in providing succinct, AI-generated summaries for free text columns and intuitive charts, turning complex data into clear, actionable insights efficiently.

User-Friendly Interface

Designed for ease of use, AddMaple allows users, regardless of their technical background, to dive into EDA without the steep learning curve often associated with more complex data analysis tools.

Interactive Dashboards

Interactive and dynamic dashboards enable users to manipulate data in real-time, providing a hands-on approach to understanding and exploring datasets.

Seamless Data Integration

AddMaple can easily integrate data from various sources, providing a comprehensive view for more thorough exploratory analysis.

Fast

AddMaple has a highly optimized data engine that enables instant pivots and advanced filters - making the EDA journey not only faster, but more enjoyable.

Collaborative Features

The platform supports collaborative efforts in data analysis, allowing teams to share insights, visualizations, and reports, fostering a collaborative environment for data exploration.

Bar Chart

Life is too short to stare at spreadsheets.

AddMaple to your data

Sign up