AddMaple AI
AI grounded in statistics, built for real analysis
AddMaple is an exploration-first analytics platform, powered by AI where it genuinely helps. Not to replace your thinking, but to accelerate it.
- Interprets real calculations, pivots, and statistical tests
- Keeps you in the driving seat with editable analysis objects
- Turns questions into evidence-backed answers
See AddMaple AI in action
Ready to see AddMaple AI in action?
Book a demo and we will show you how Maple works on real survey data. Book a demo.
AI grounded in real statistical tests
Most AI tools generate answers from language patterns. AddMaple's AI works differently. It interprets actual statistical relationships, significance tests, and pivot outputs generated across your dataset. That means faster analysis without guesswork or hallucinated conclusions.
Ask questions and get analysis, not just text
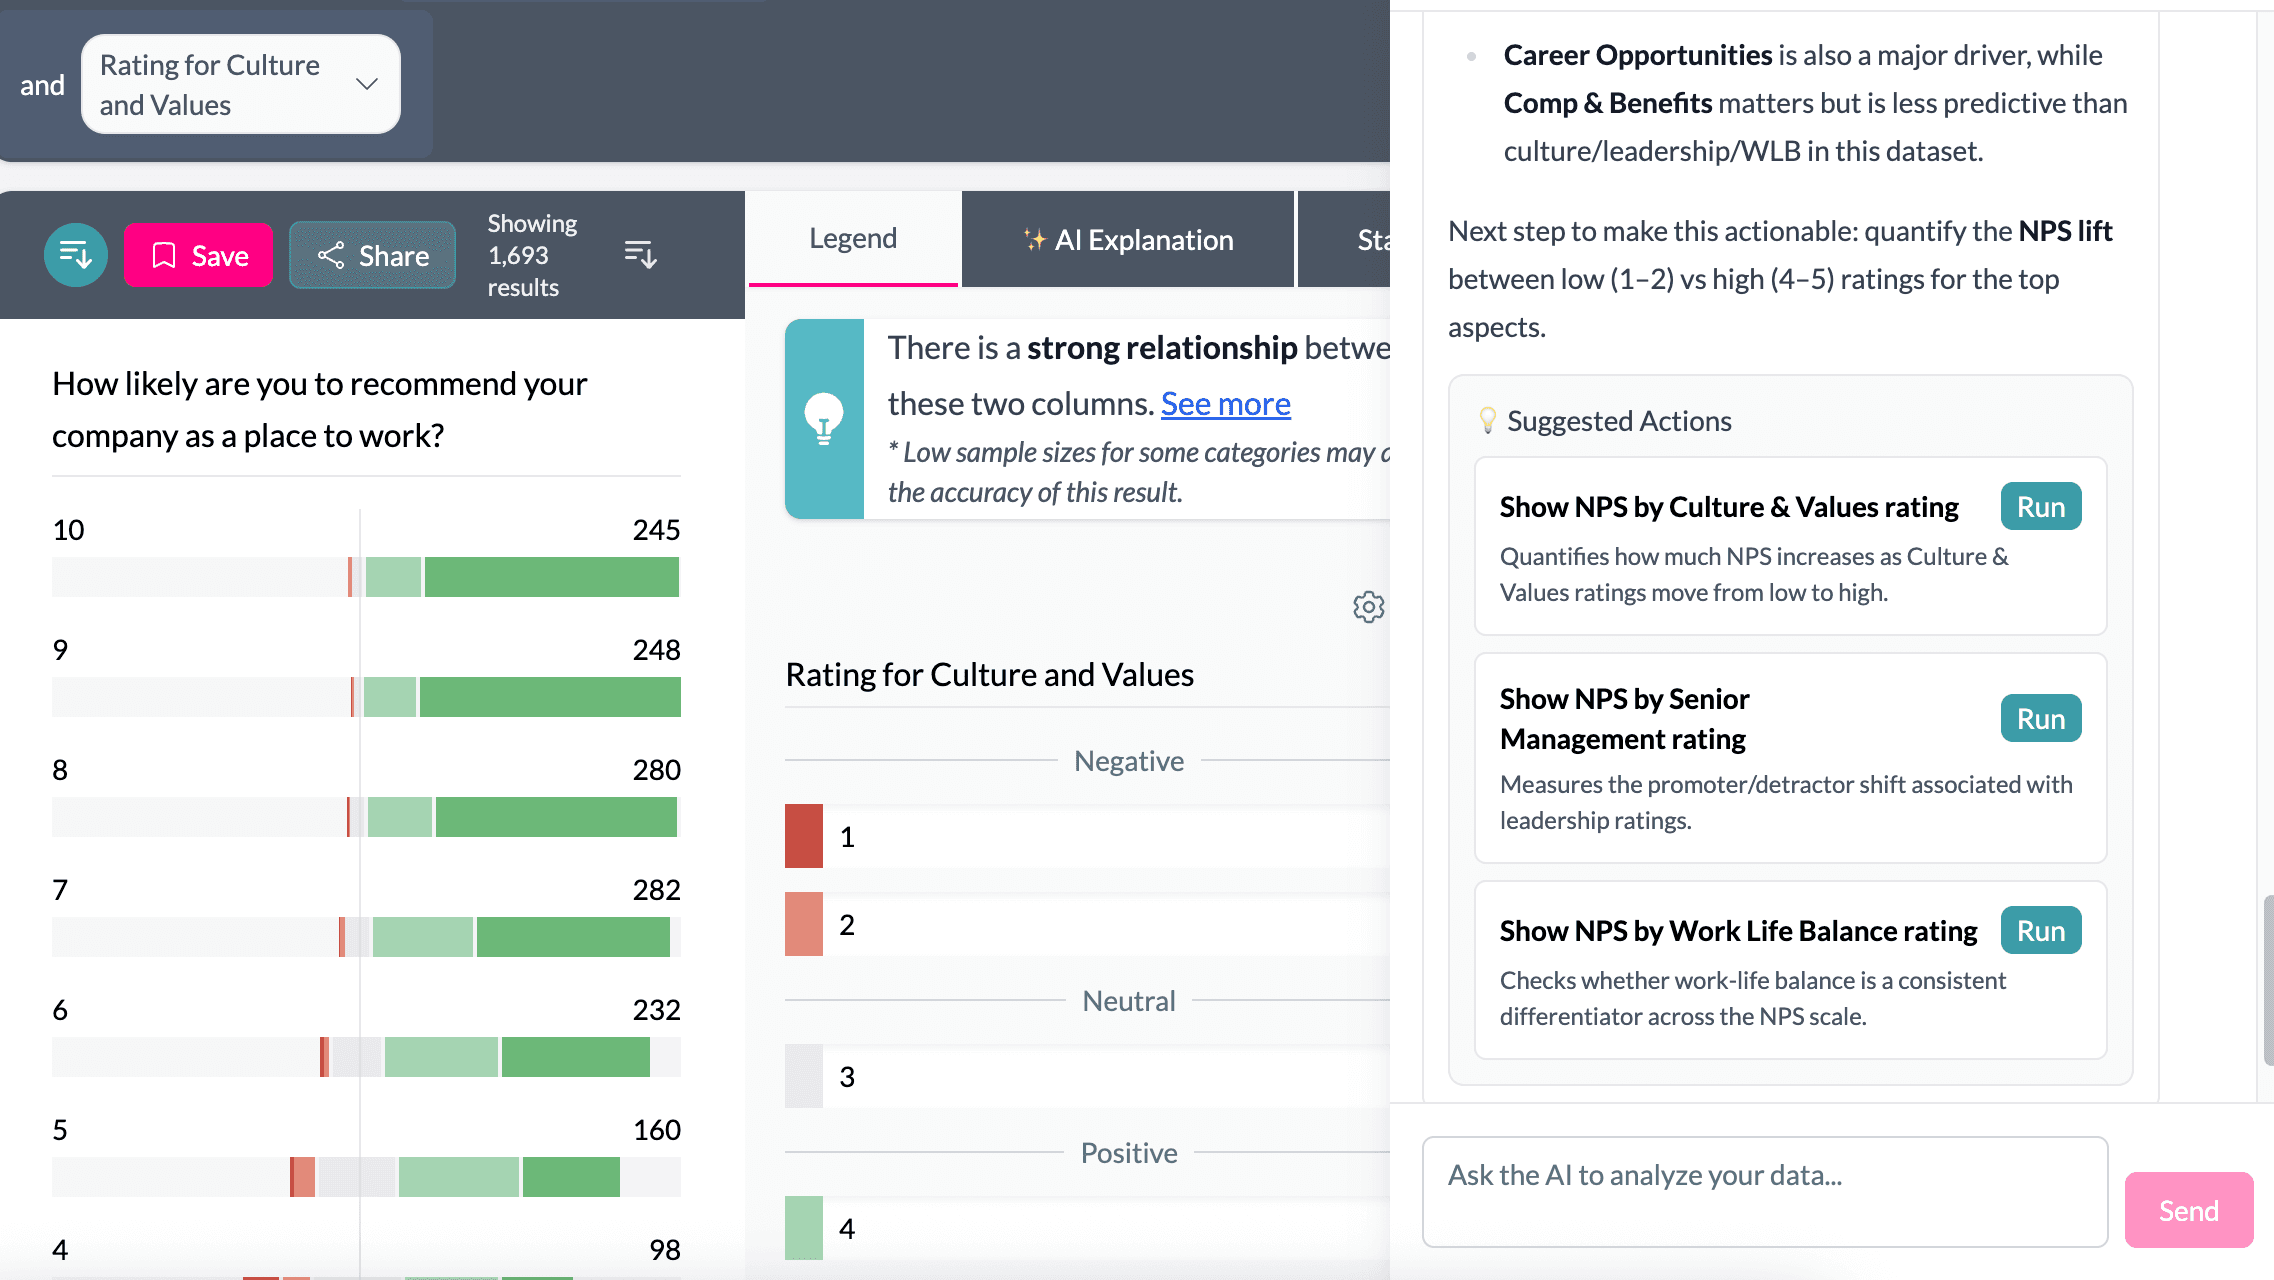
Maple does not just reply with text. It runs analysis and returns evidence-backed answers with pivots, charts, and breakdowns you can click into and edit.
Ask Maple things like:
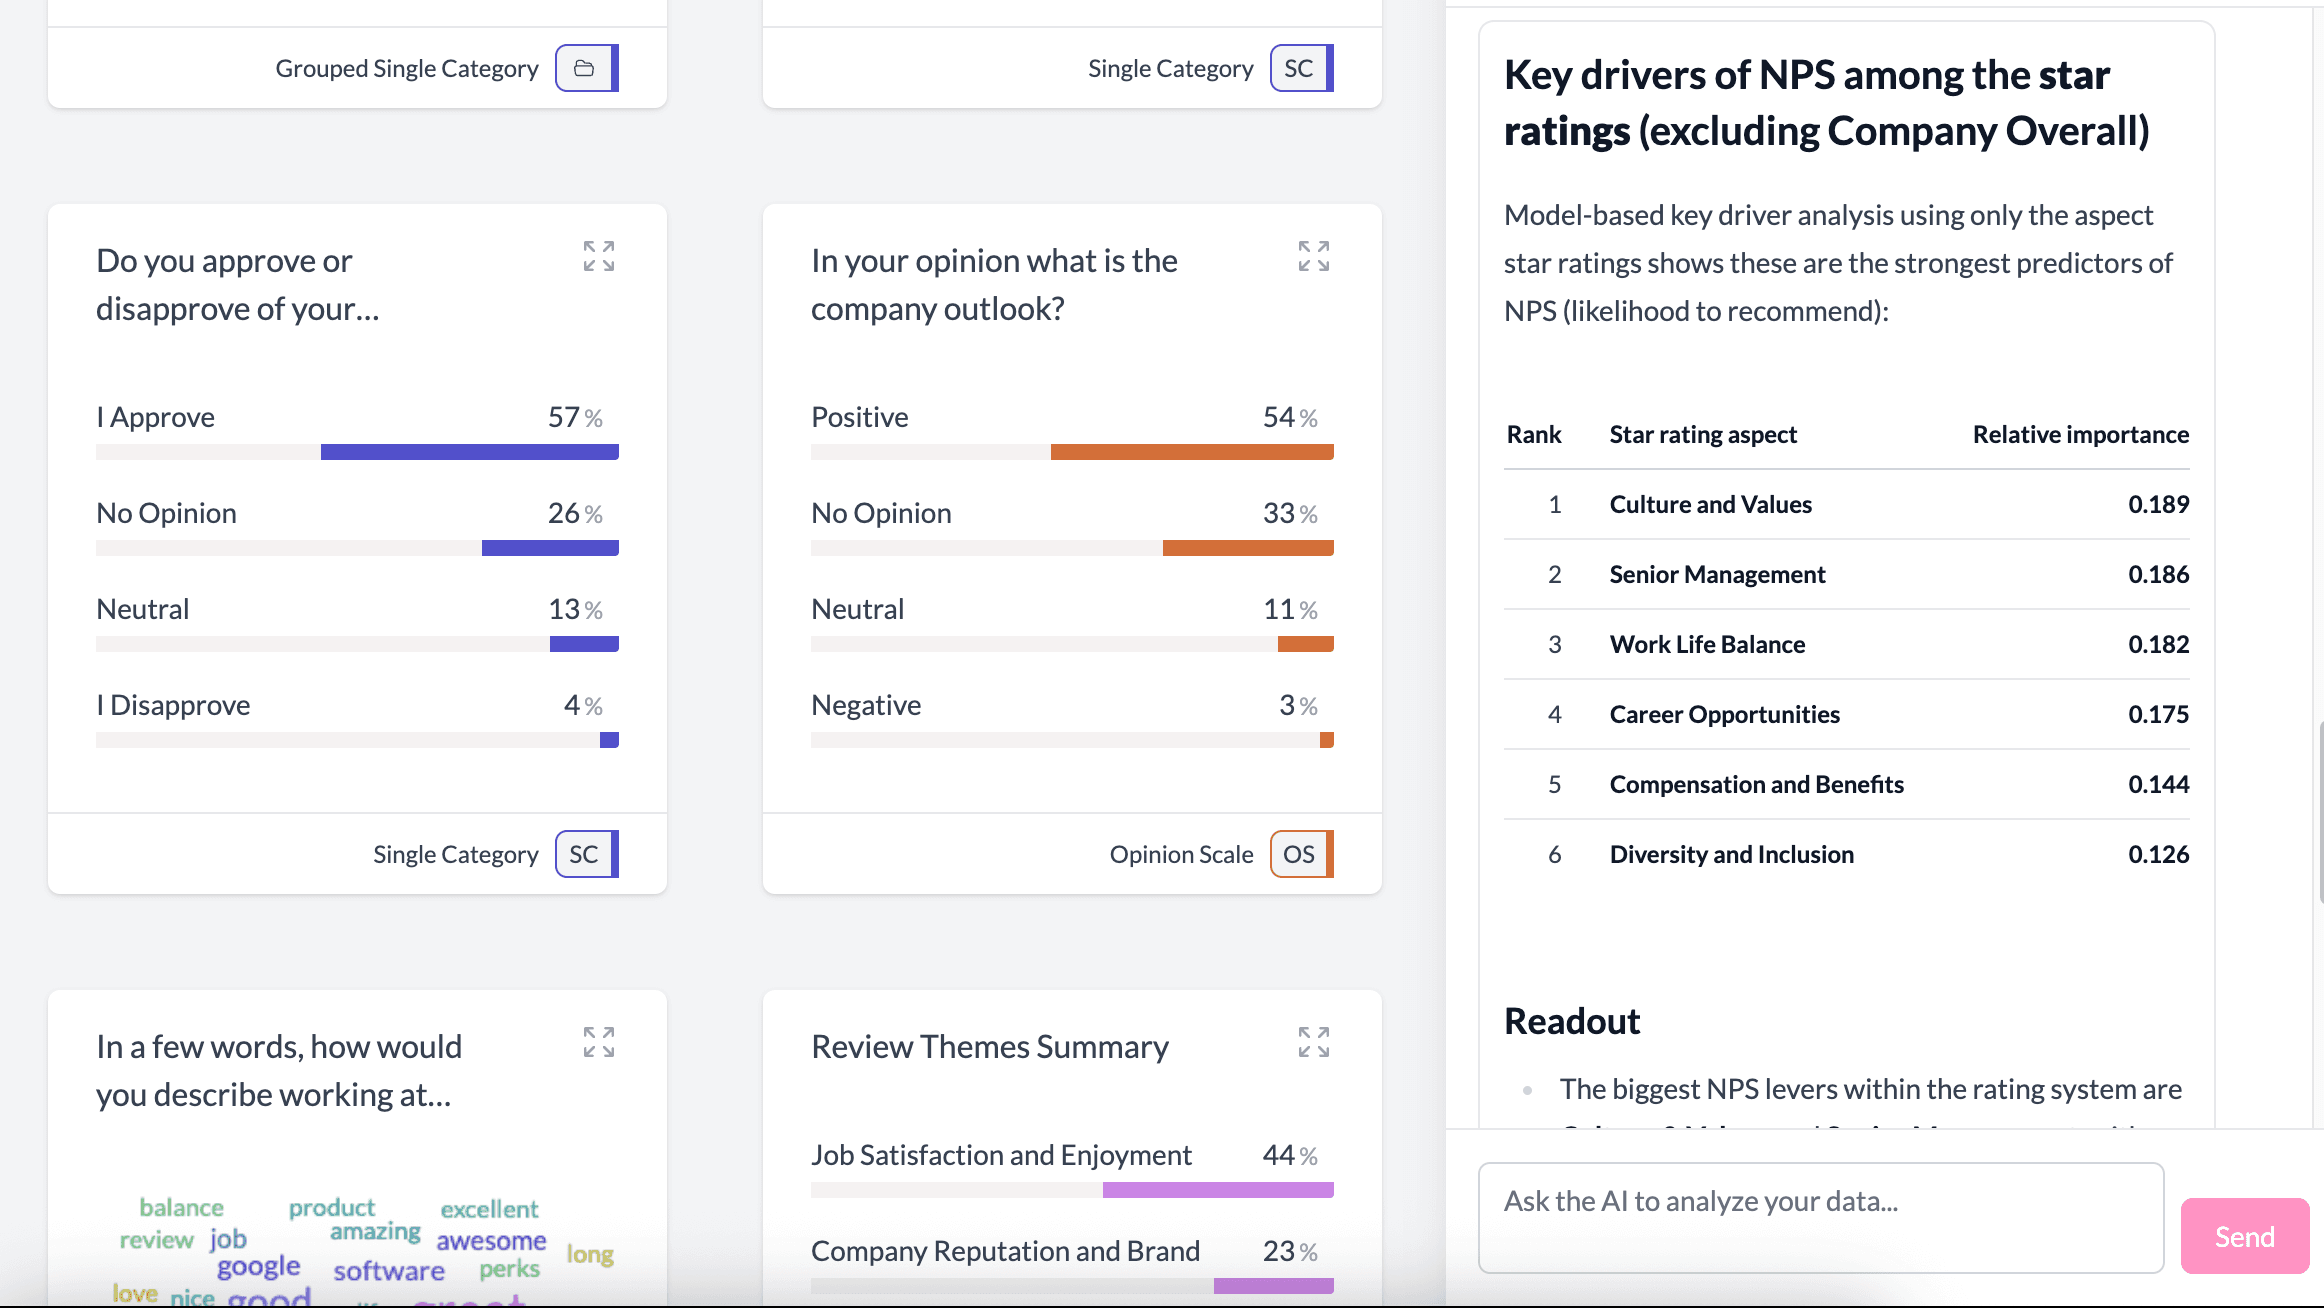
- What is driving satisfaction or NPS?
- What differs by segment, role, or country?
- Which variables are most statistically linked to churn?
- What changed this month vs last?
- What is the strongest driver behind this score?
What makes Maple different:
- grounded in AddMaple's statistics engine
- highlights under-represented groups so you do not overinterpret noise
- links directly to pivots and charts you can edit
- keeps you in control of the workflow
Coming soon: Maple can build dashboards for you automatically.
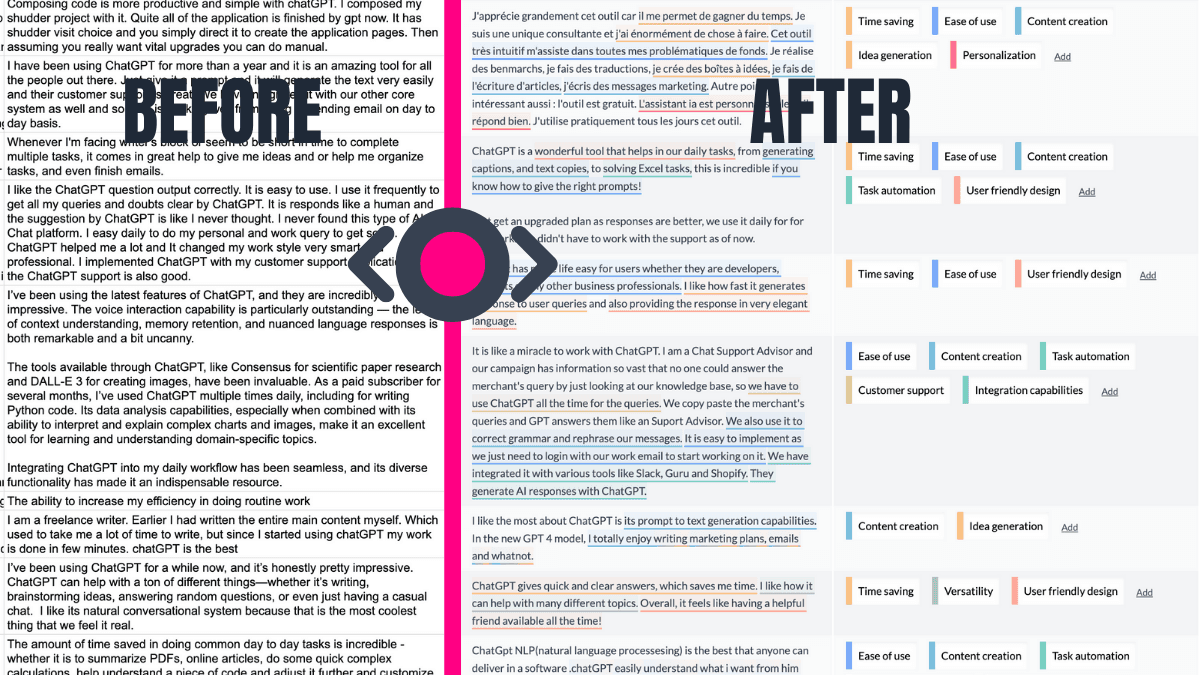
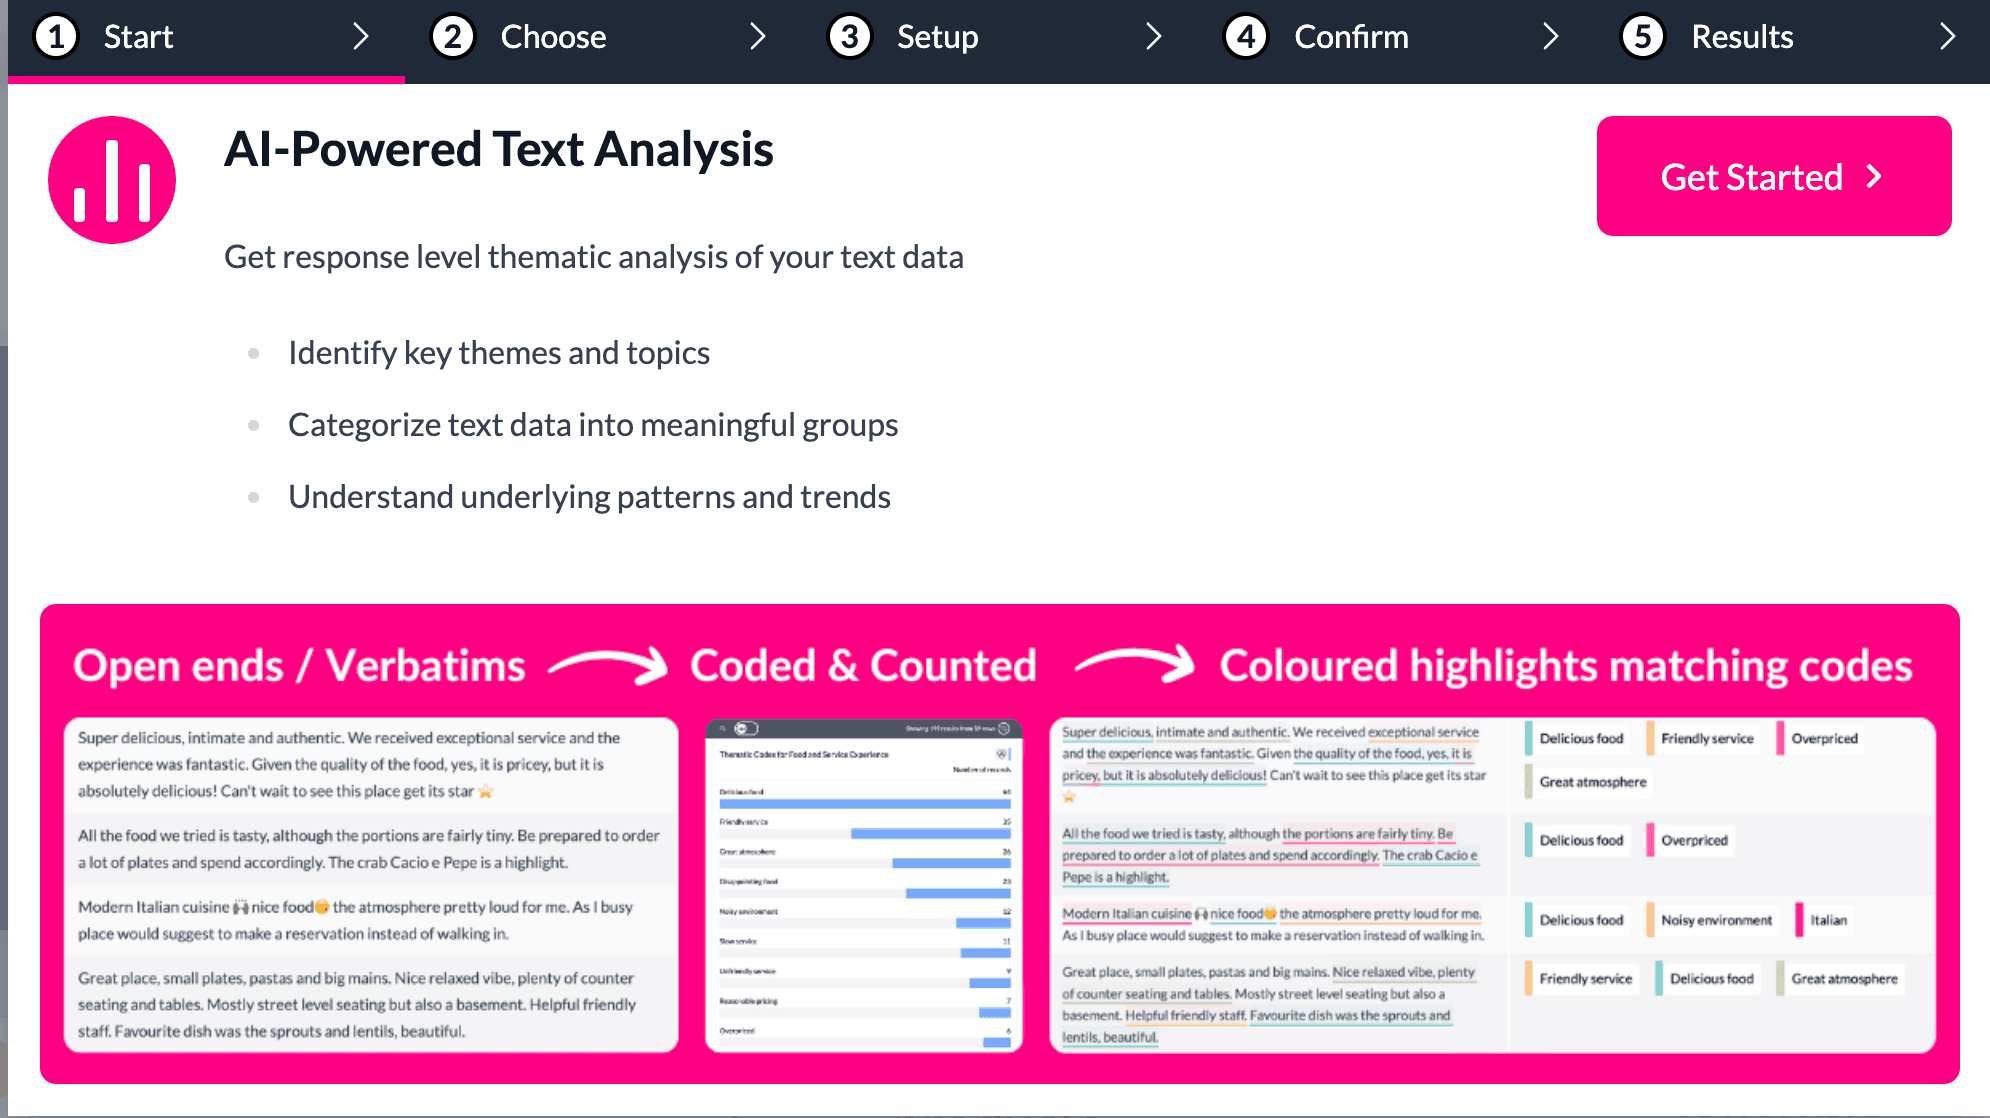
Turn open ends into structured variables
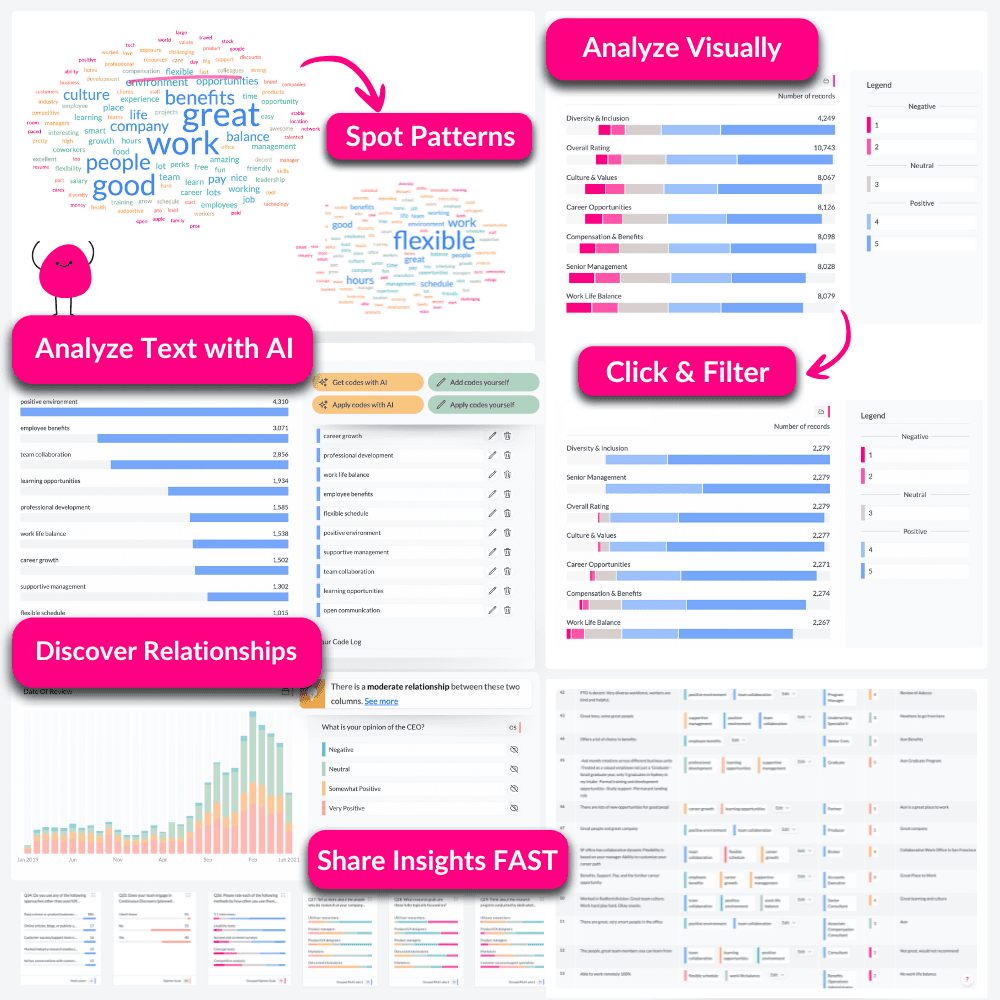
Turn unstructured text into structured insight. AddMaple can code thousands of open-ended responses into themes and sub-themes, based on your research goal and the verbatims in your dataset.
How it works:
- Tell AddMaple what you want to understand
- AddMaple generates a suggested codebook
- Edit and confirm it
- Apply it across the full dataset instantly
Built for research-grade work:
- full codebook with descriptions and verbatim examples
- transparent coding with highlighted text traceability
- supports multi-tagging (one response can match multiple themes)
- supports sentiment per theme
- supports sub-theme deep dives via multiple coding rounds
Once coded, themes become structured variables you can filter, pivot, and statistically test like any other column.
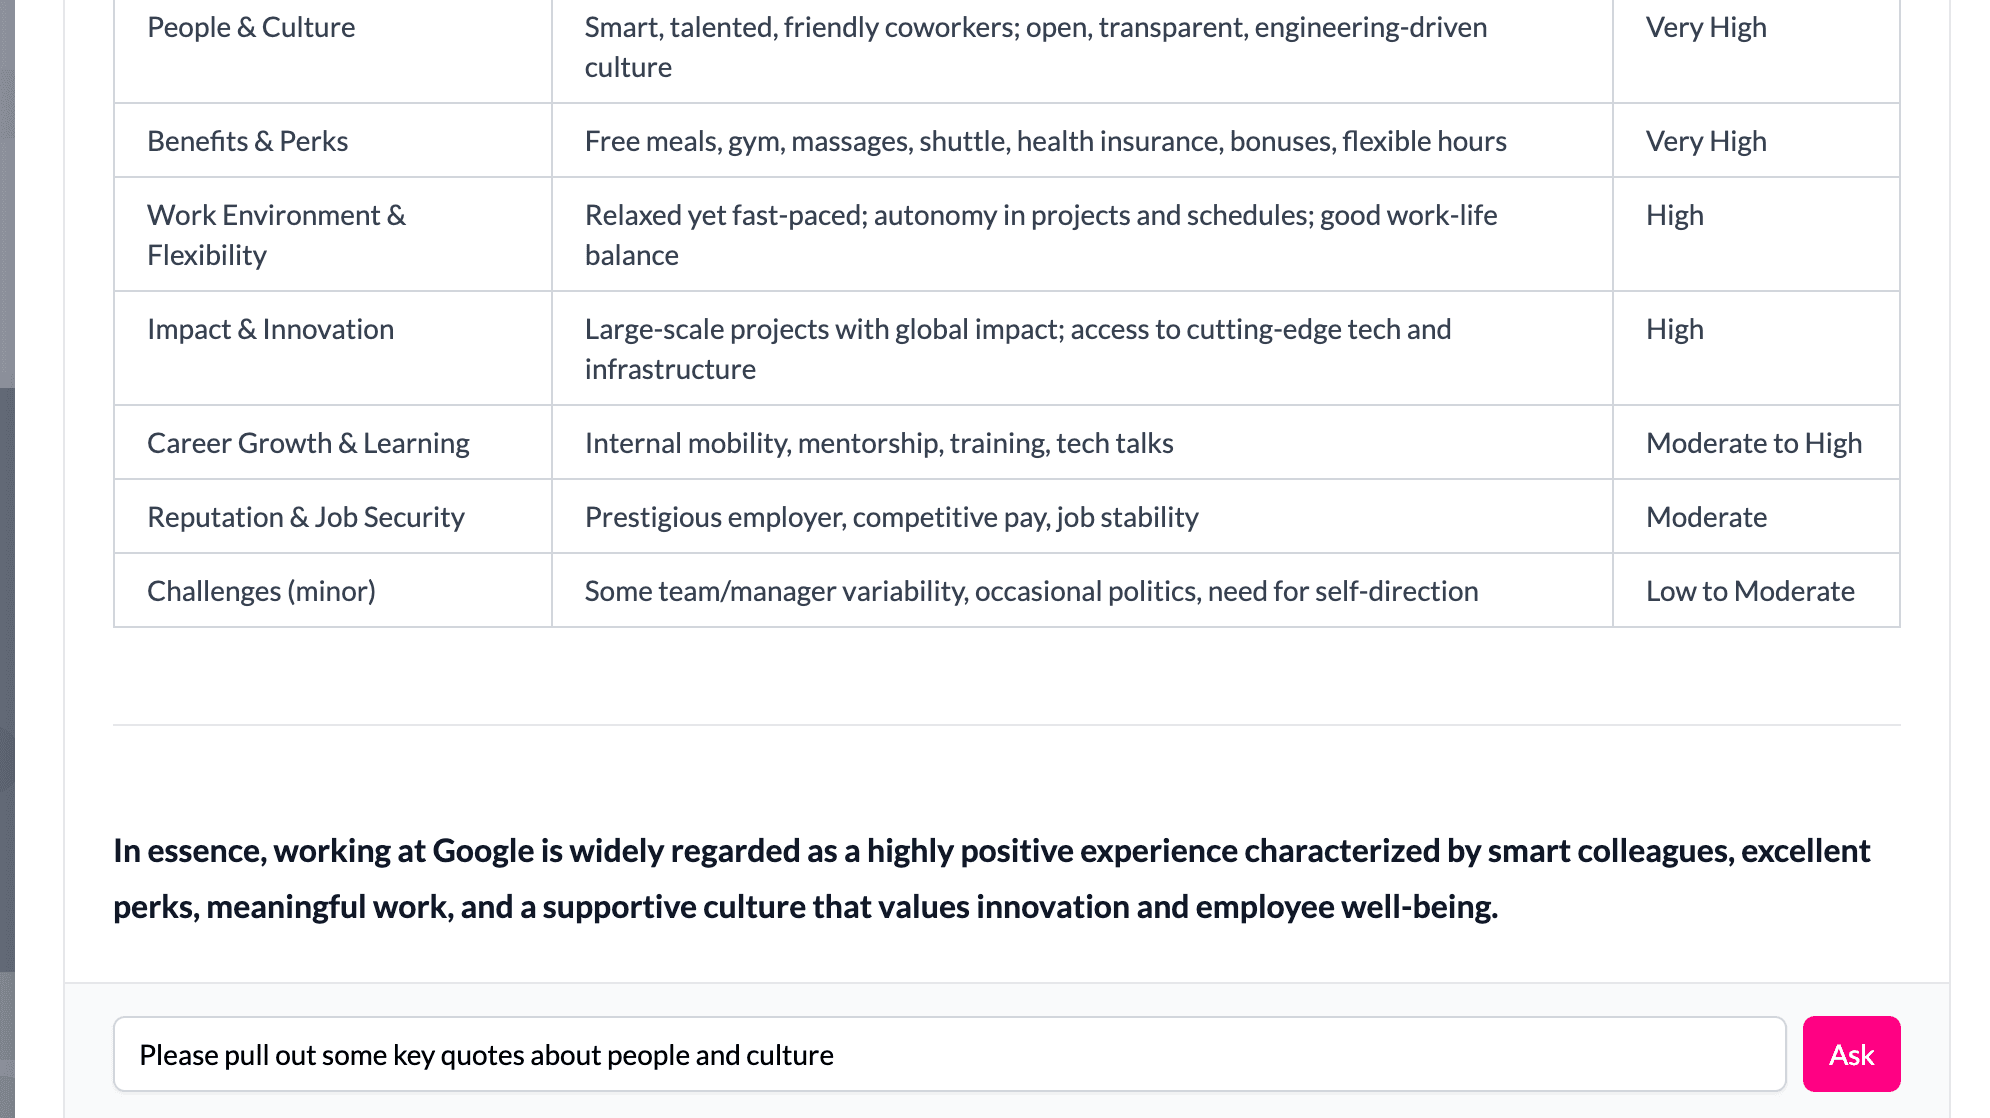
Explore raw text without a codebook
Not every project needs thematic coding. Sometimes you want to interrogate the raw verbatims directly and ask follow-up questions. AddMaple lets you ask questions against a verbatim column, with the ability to refine and explore naturally, even on filtered subsets.
Examples:
- What are Apple engineers saying about leadership?
- What complaints increased this month?
- What is the most common frustration among promoters?
- What do detractors mention most often?
It is qualitative exploration with context, not generic summarization.
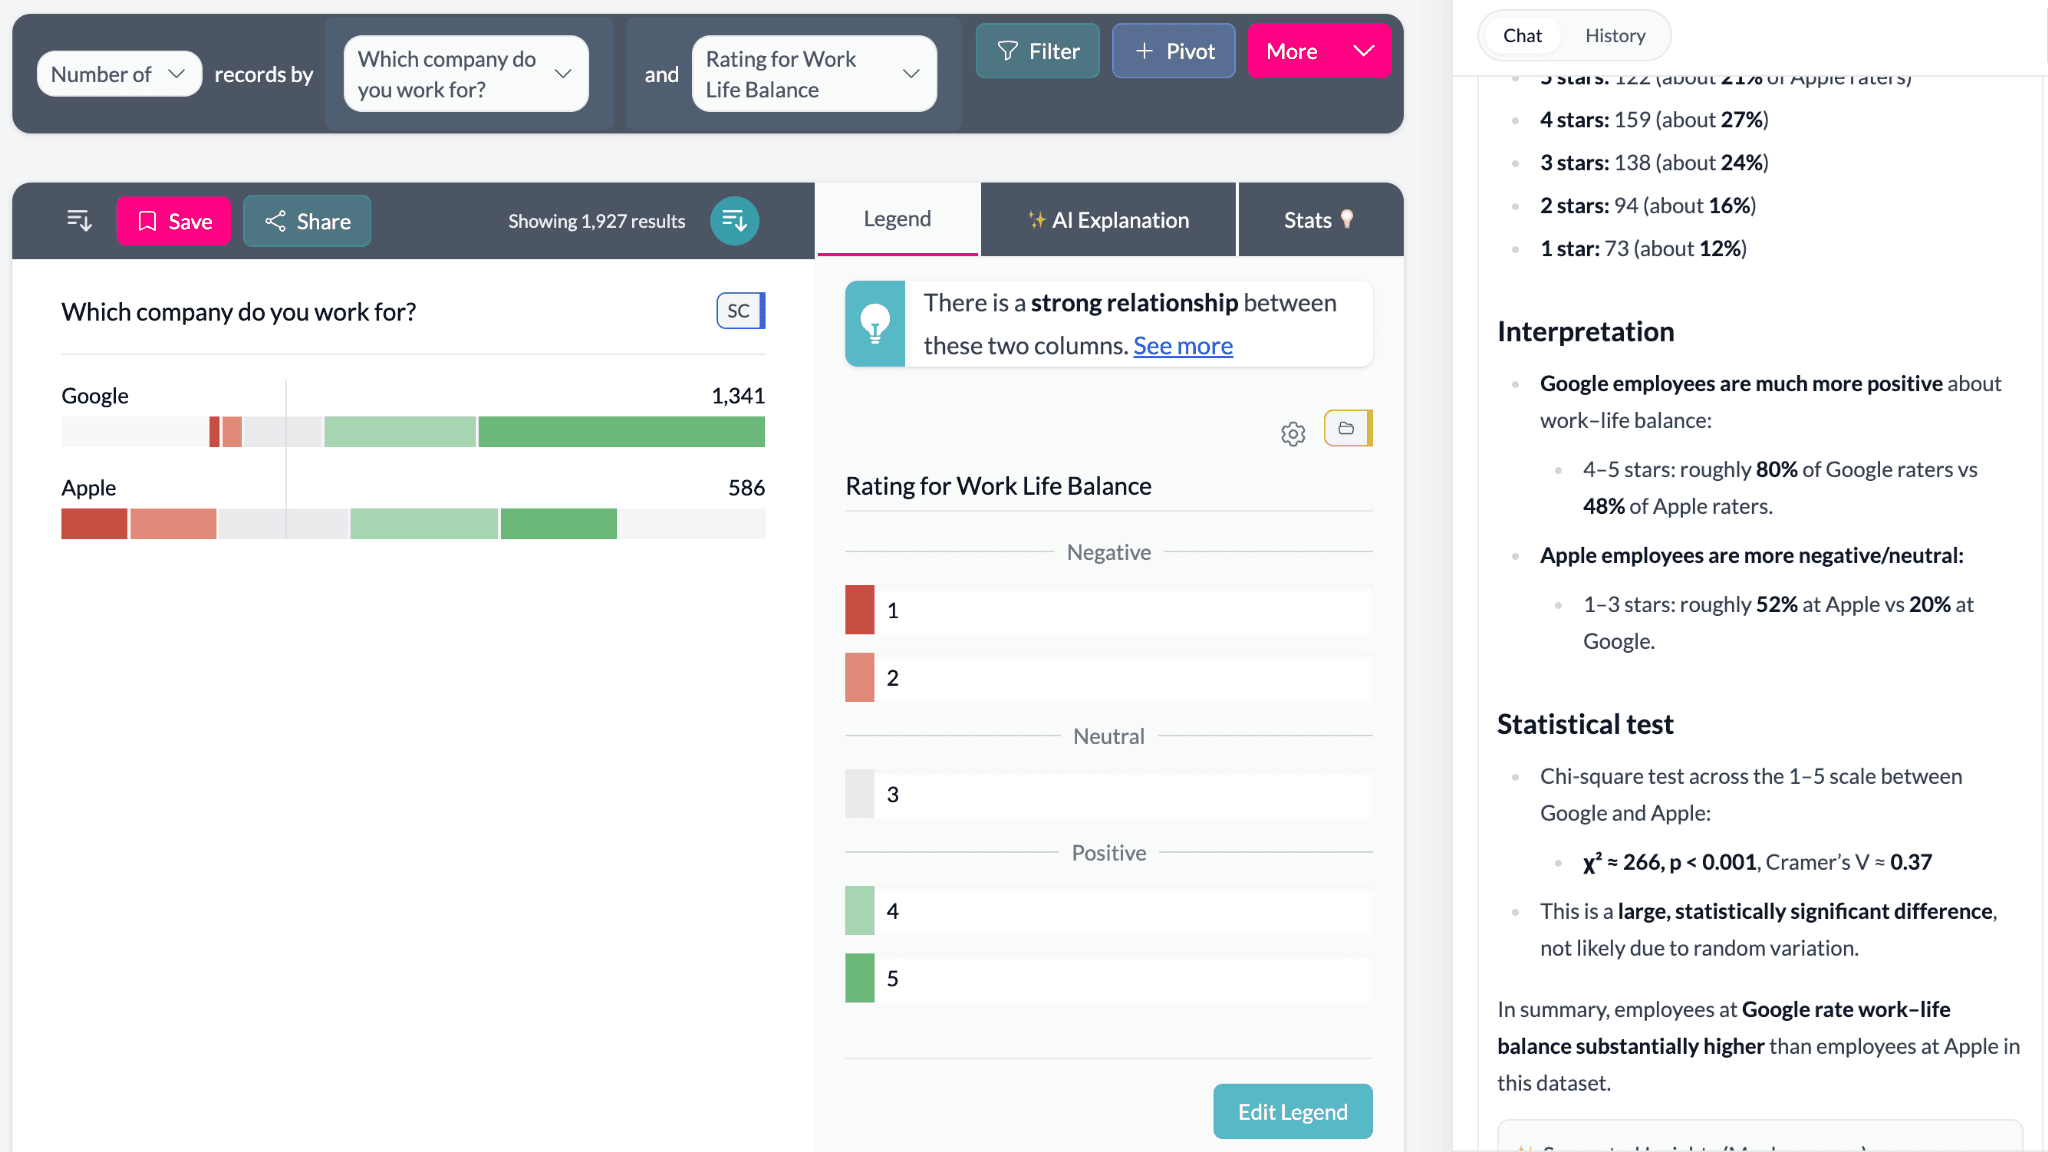
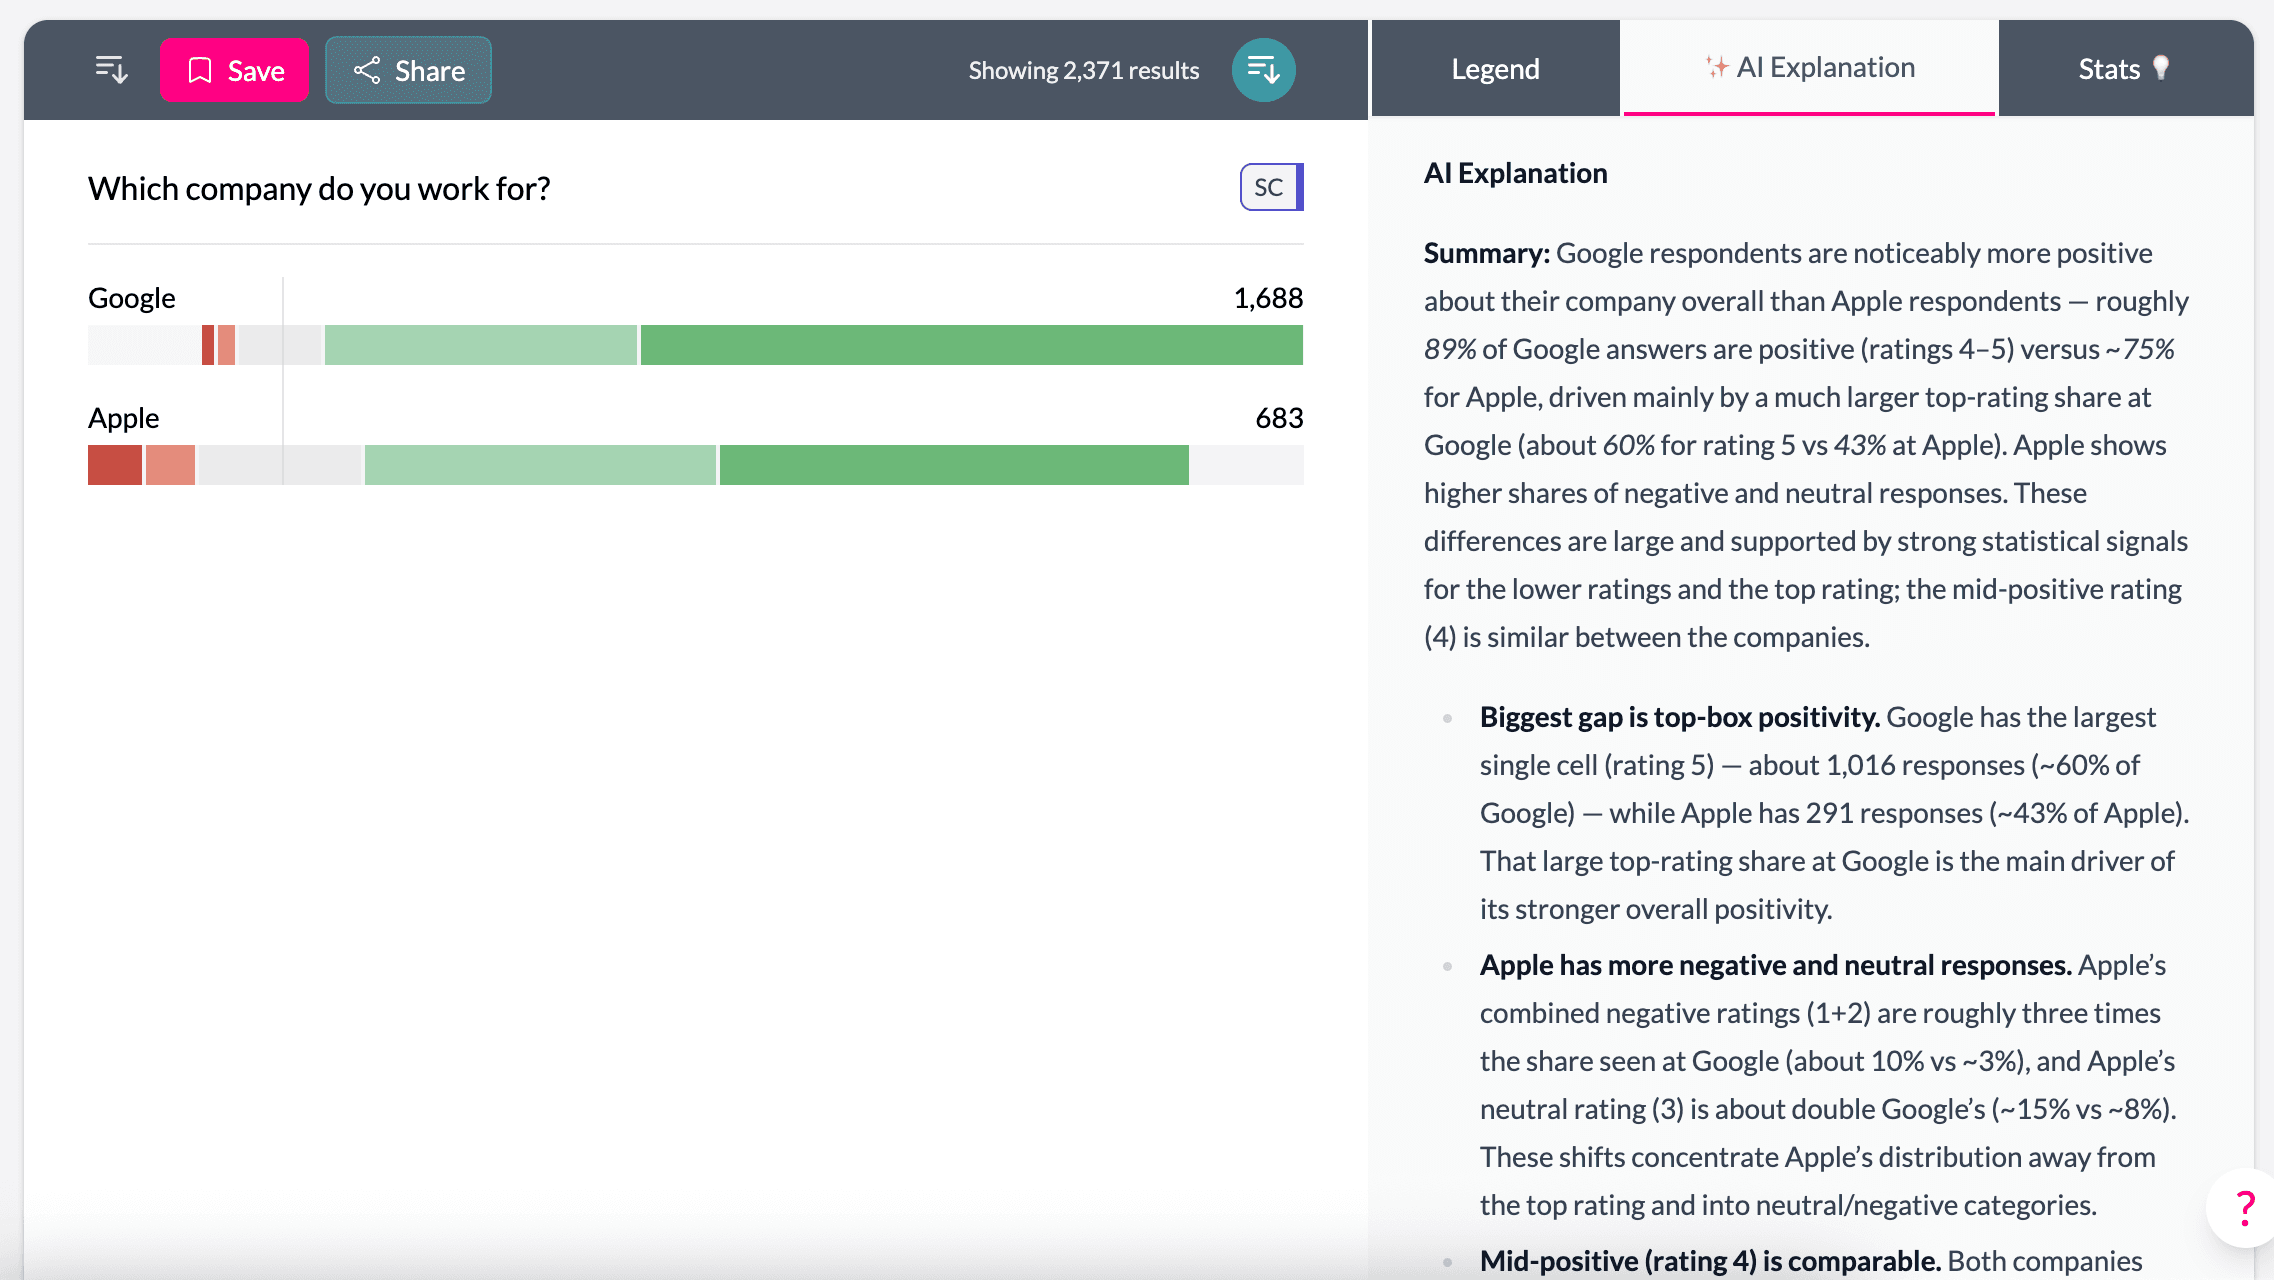
Instantly interpret charts and pivots
AddMaple can explain what you are seeing on screen. Whether you are looking at a pivot table, a Likert chart, a crosstab, or a significance-tested comparison, AI explanations help you interpret results quickly and clearly.
Use AI explanations to:
- summarize what a chart is showing
- highlight what is notable
- explain significant differences
- translate results into clear language
- support reporting and storytelling
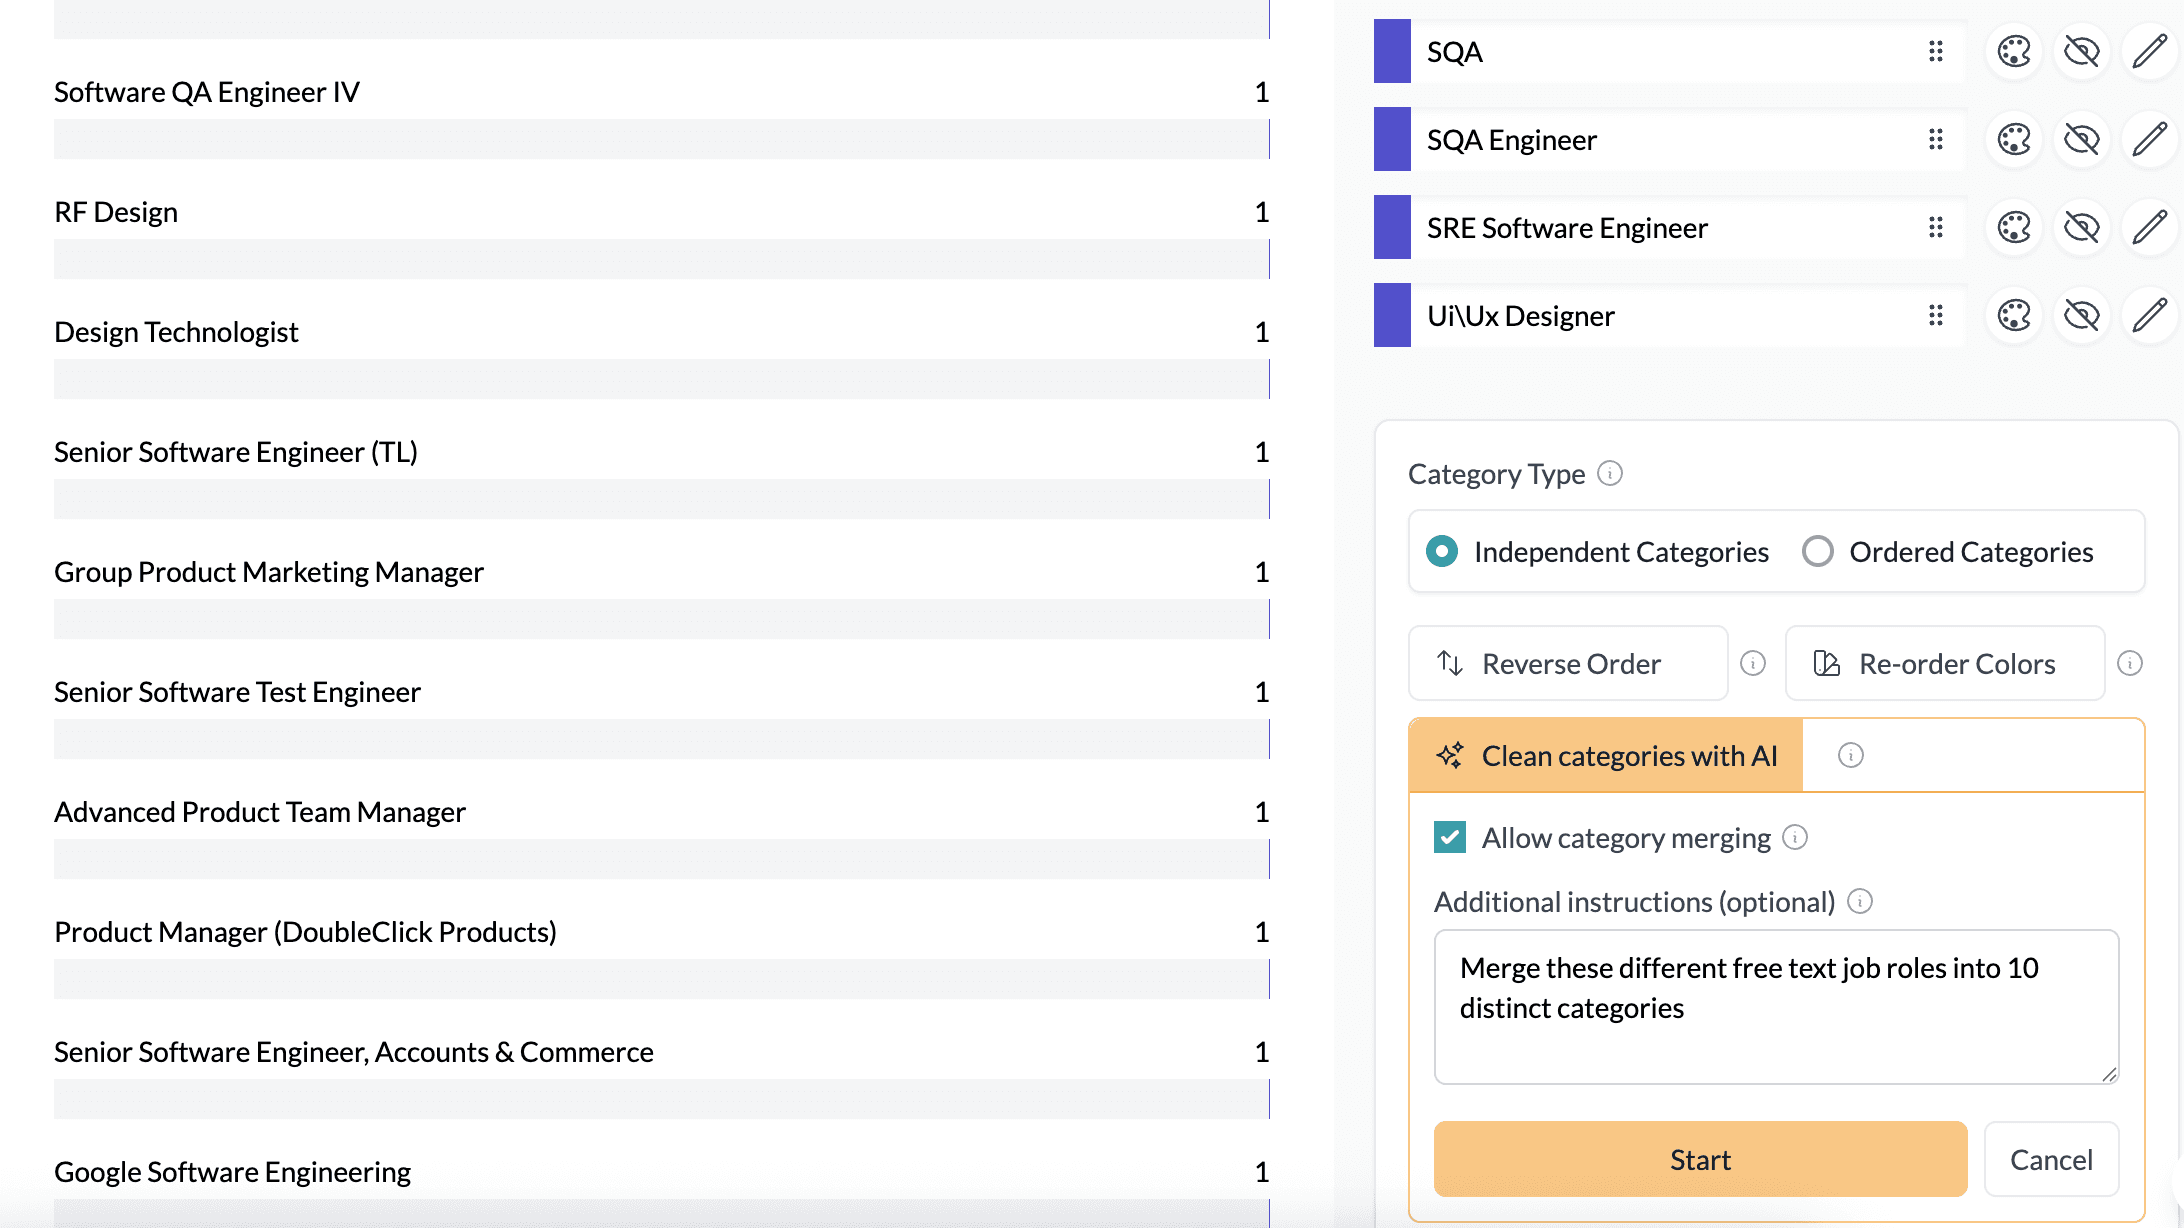
Clean messy survey data without losing control
Survey data is rarely analysis-ready. AddMaple detects question types and structures your dataset for analysis, while giving you AI-assisted tools to clean and configure labels and categories.
Use AI to:
- clean question wording into readable labels
- turn long category lists into meaningful buckets
- merge categories for clearer charts
- reorder scales properly
- standardize labels across datasets
Everything remains editable and transparent, so you stay in control.
From raw responses to decision-ready insight
From raw responses to decision-ready insight, fast. AddMaple is built for market researchers and insights teams who need to move quickly without sacrificing rigor. Explore datasets instantly, compare segments, find drivers, analyze open ends, and build a dashboard as you go.
Frequently Asked Questions
Does AddMaple AI "generate insights" like other AI tools?
Not in the risky sense. AddMaple's AI is grounded in AddMaple's statistics engine and chart engine. Instead of inventing conclusions, it interprets real pivots, real calculations, and real statistical tests that are run programmatically across your dataset. This keeps results evidence-based and traceable.
How is AddMaple AI different from ChatGPT or generic AI tools?
Generic AI tools can summarize text, but they do not understand your dataset as a structured analytical system. AddMaple AI works inside an analytics engine. It can interpret quantitative results, explain significance-tested pivots, guide analysis, and create charts and tables you can click into and edit. It is AI designed for analysis, not just writing.
Can Maple run analysis for me, or does it only answer in text?
Maple does more than answer in text. When you ask a question, Maple can run deep analysis such as pivots, breakdowns, key driver exploration, segmentation logic, clustering, and statistical testing. It then links you directly to pivot charts and tables you can explore and edit.
How does Maple avoid misleading conclusions?
Maple is guided by AddMaple's statistics engine. That means it can highlight things like under-represented groups, weak sample sizes, or relationships that are not statistically meaningful. It helps prevent false insight and keeps exploration focused on what is real.
Can I edit the charts and pivots Maple creates?
Yes. AddMaple's AI does not produce locked outputs. It uses AddMaple's chart engine to create real pivots and charts, and you can edit them like any other analysis view. You stay in control of the workflow.
Does AddMaple support AI thematic coding?
Yes. AddMaple supports full thematic coding for open-ended responses. AI generates a suggested codebook grounded in your verbatims, including definitions and real examples from the dataset. You can edit the codebook, then apply it across thousands of responses. Themes can then be filtered, pivoted, and statistically tested like any other variable.
Is the coding transparent and traceable?
Completely. Every coded response is traceable back to the original text. AddMaple highlights the exact part of each verbatim that triggered a code, so you can validate results and avoid black-box assumptions.
Can one response be assigned multiple themes?
Yes. AddMaple supports multi-tagging, meaning a single response can be assigned multiple themes when appropriate. This is essential for real-world qualitative analysis.
Does AddMaple support sentiment analysis?
Yes. AddMaple can attach sentiment per theme, helping you understand not only what topics are being mentioned, but whether they are being mentioned positively or negatively.
Do I have to use thematic coding to analyze text?
No. If you do not want to build a codebook, you can explore a verbatim column using AI Q&A. This lets you ask follow-up questions and explore what people are saying, including within filtered segments.
Can AddMaple AI explain charts and statistical tests?
Yes. AddMaple AI can explain pivots, charts, and significance-tested comparisons in clear language, helping you quickly interpret results and communicate findings to others.
Can AddMaple help clean messy survey datasets?
Yes. AddMaple automatically detects question types and structures your dataset for analysis. It also supports AI-assisted cleaning and configuration, including relabeling questions, merging categories, and turning messy category lists into useful buckets for segmentation and reporting. Everything remains editable.
Is AddMaple AI a black box?
No. This is one of the biggest differences between AddMaple and other AI analytics tools. AddMaple AI is built on top of a statistics engine and chart engine, so every output is inspectable, editable, and grounded in real calculations.
Can AddMaple be used for market research, CX, EX, and product feedback?
Yes. AddMaple is designed for real survey analysis across market research, customer experience, product research, UX, and employee experience datasets, especially when you need to combine quantitative and qualitative insight in one workflow.
How do I get started?
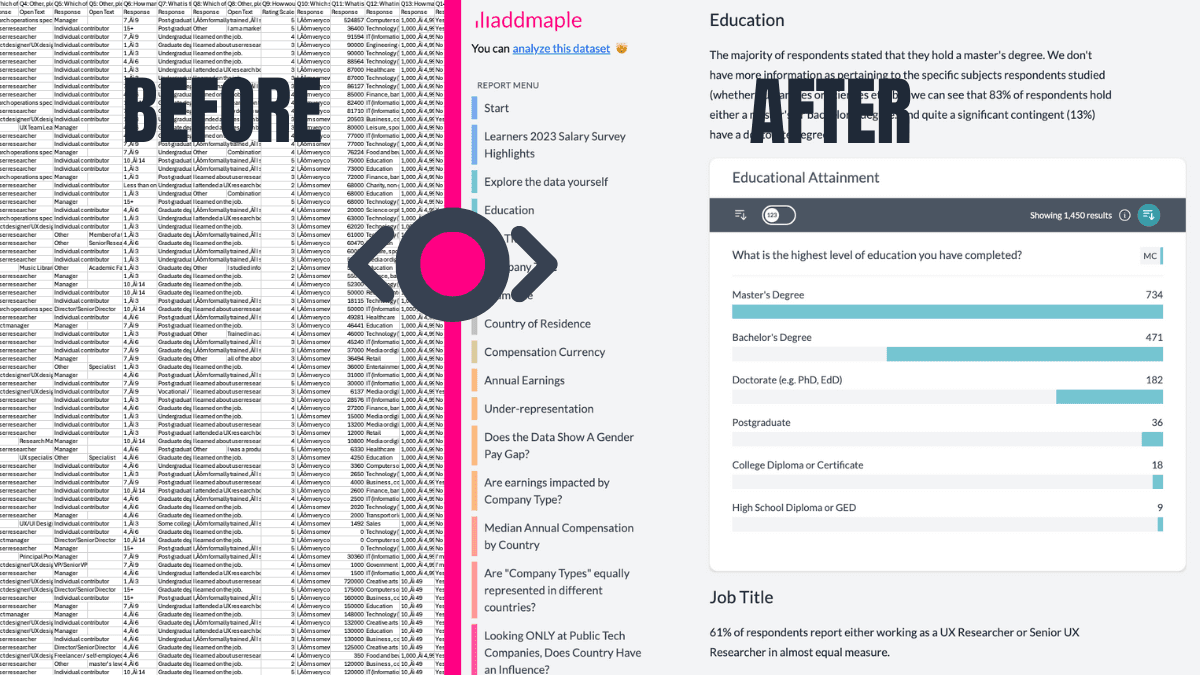
Just connect your dataset and start exploring. Once your data is loaded, AddMaple automatically summarizes every question into charts and tables instantly. From there you can filter, pivot, compare segments, analyze text with AI, and build dashboards as you go. Book a demo.
Integrations
Bring your data to us from any platform and get an instant explore-ready dashboard


AddMaple creates instant chart dashboards that let you analyze your survey data visually and is one of the best ways I've found to conduct AI-powered thematic analysis of open-ended results.


AddMaple: Why AddMaple AI is different
Not a black box. Not a report generator. A real analysis engine. AddMaple's AI sits on top of a statistics engine, a chart engine, and a pivot engine, so it produces real analytical objects you can click into, edit, and keep exploring.
Grounded in real statistics
AI interpretations are based on statistical testing, pivots, and chart outputs already run across your dataset.
Exploration-first, not auto-reporting
You stay in control of the workflow, with AI accelerating your analysis instead of replacing your thinking.
Real analytical objects
Pivots, tables, charts, filters, and breakdowns are generated so you can inspect, edit, and continue exploring.
Features to keep you in flow
AddMaple automates data structuring and cleansing because it:
- handles empty cells grouping them off, bypassing the need for placeholder values
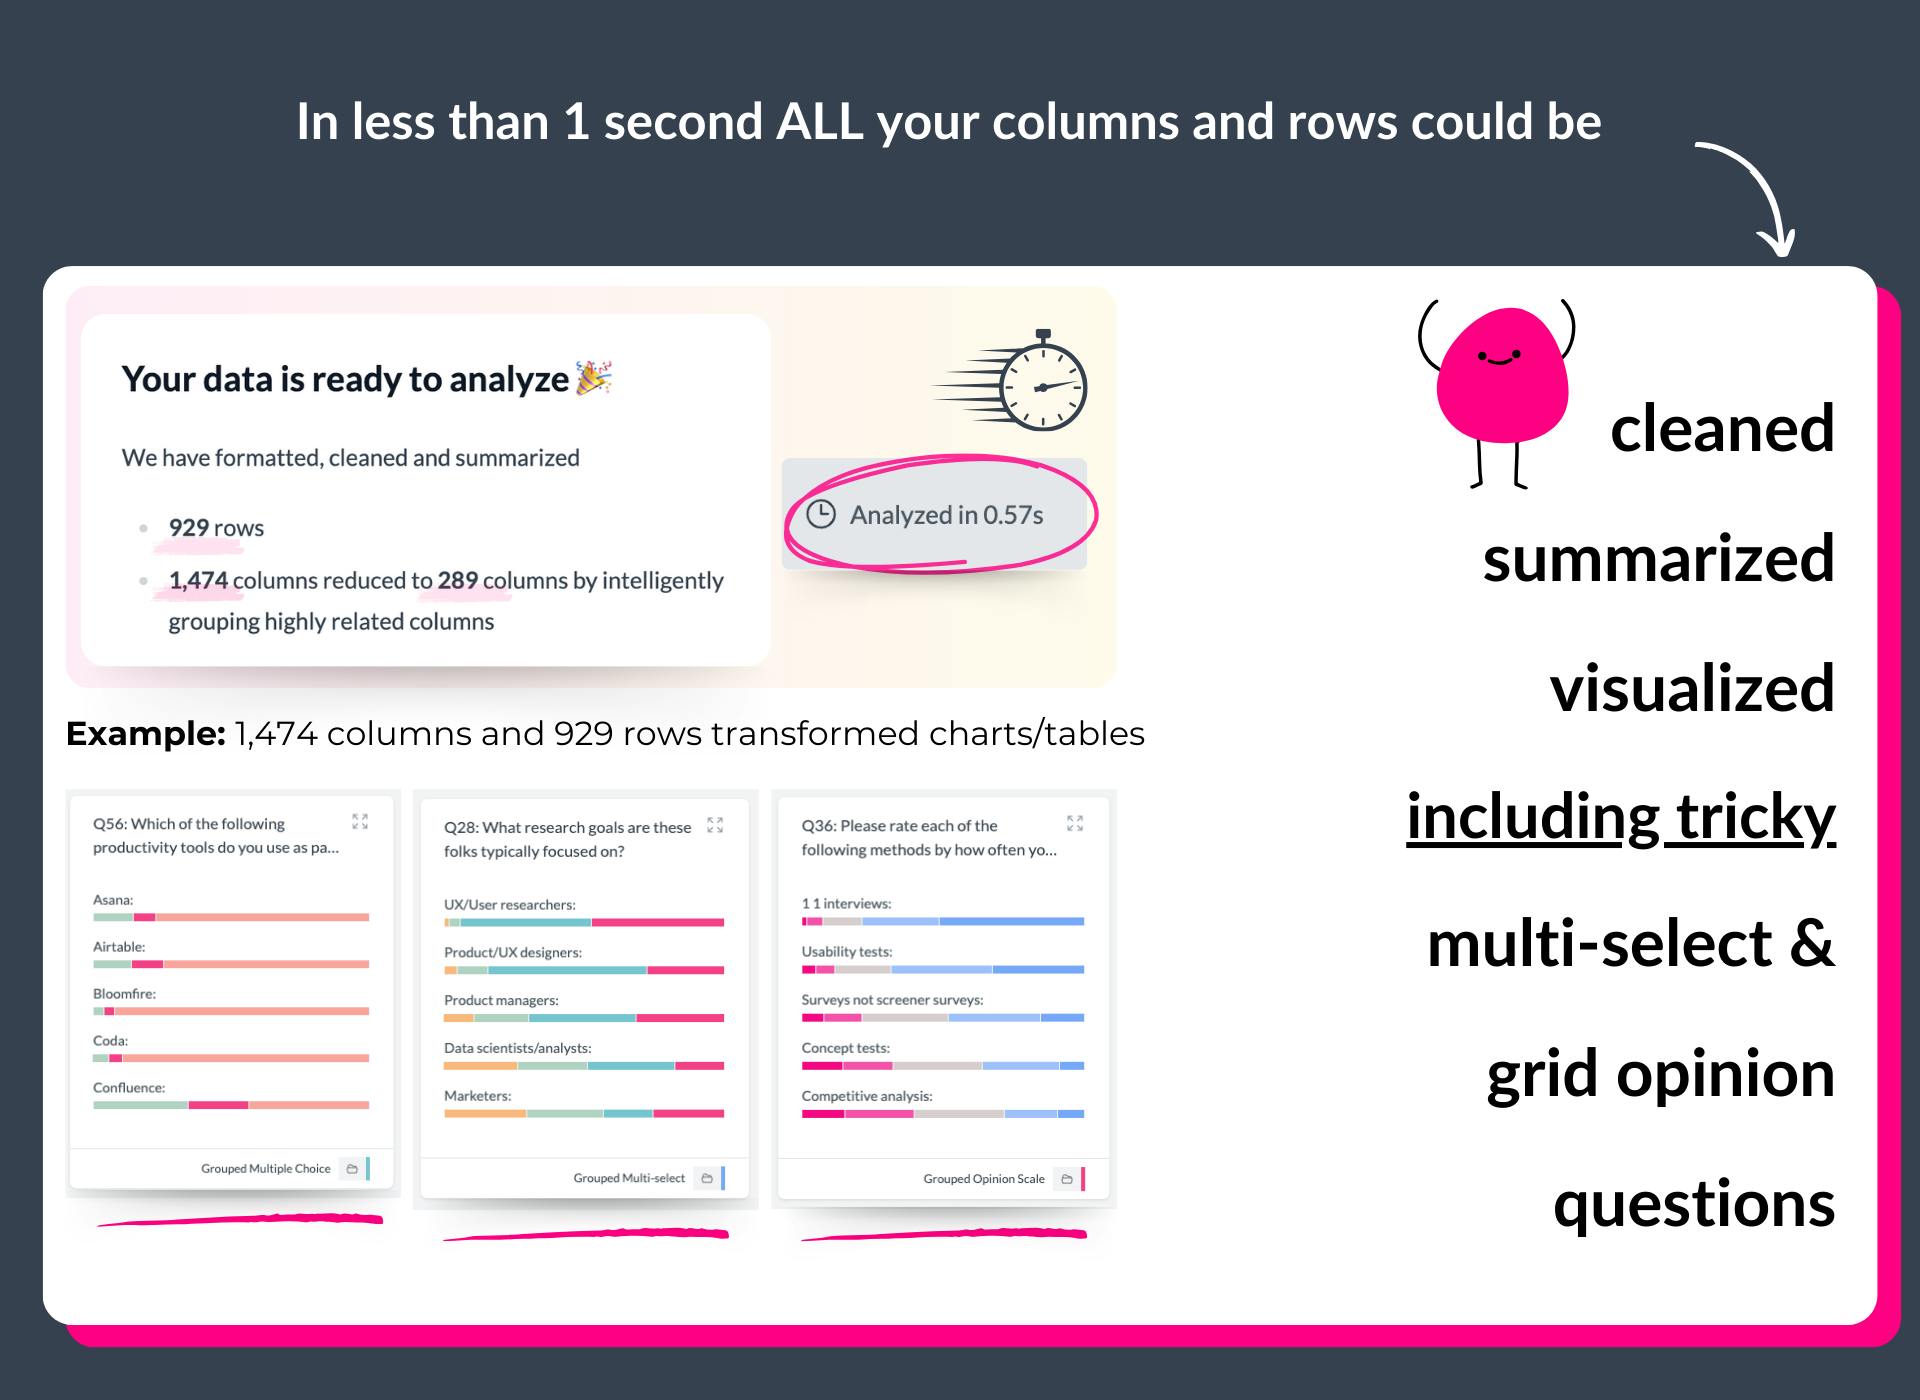
- identifies and summarizes diverse data types: numbers, currencies, dates, text, survey questions, duration, multiple choice, multi-select, matrix, opinions, grid questions and more
- recognizes data patterns: multi-select tags, word and phrase clusters within text responses, numeric data distribution and more
- buckets numeric data into appropriate bins based on their range and distribution, while identifying and restricting the impact of outliers
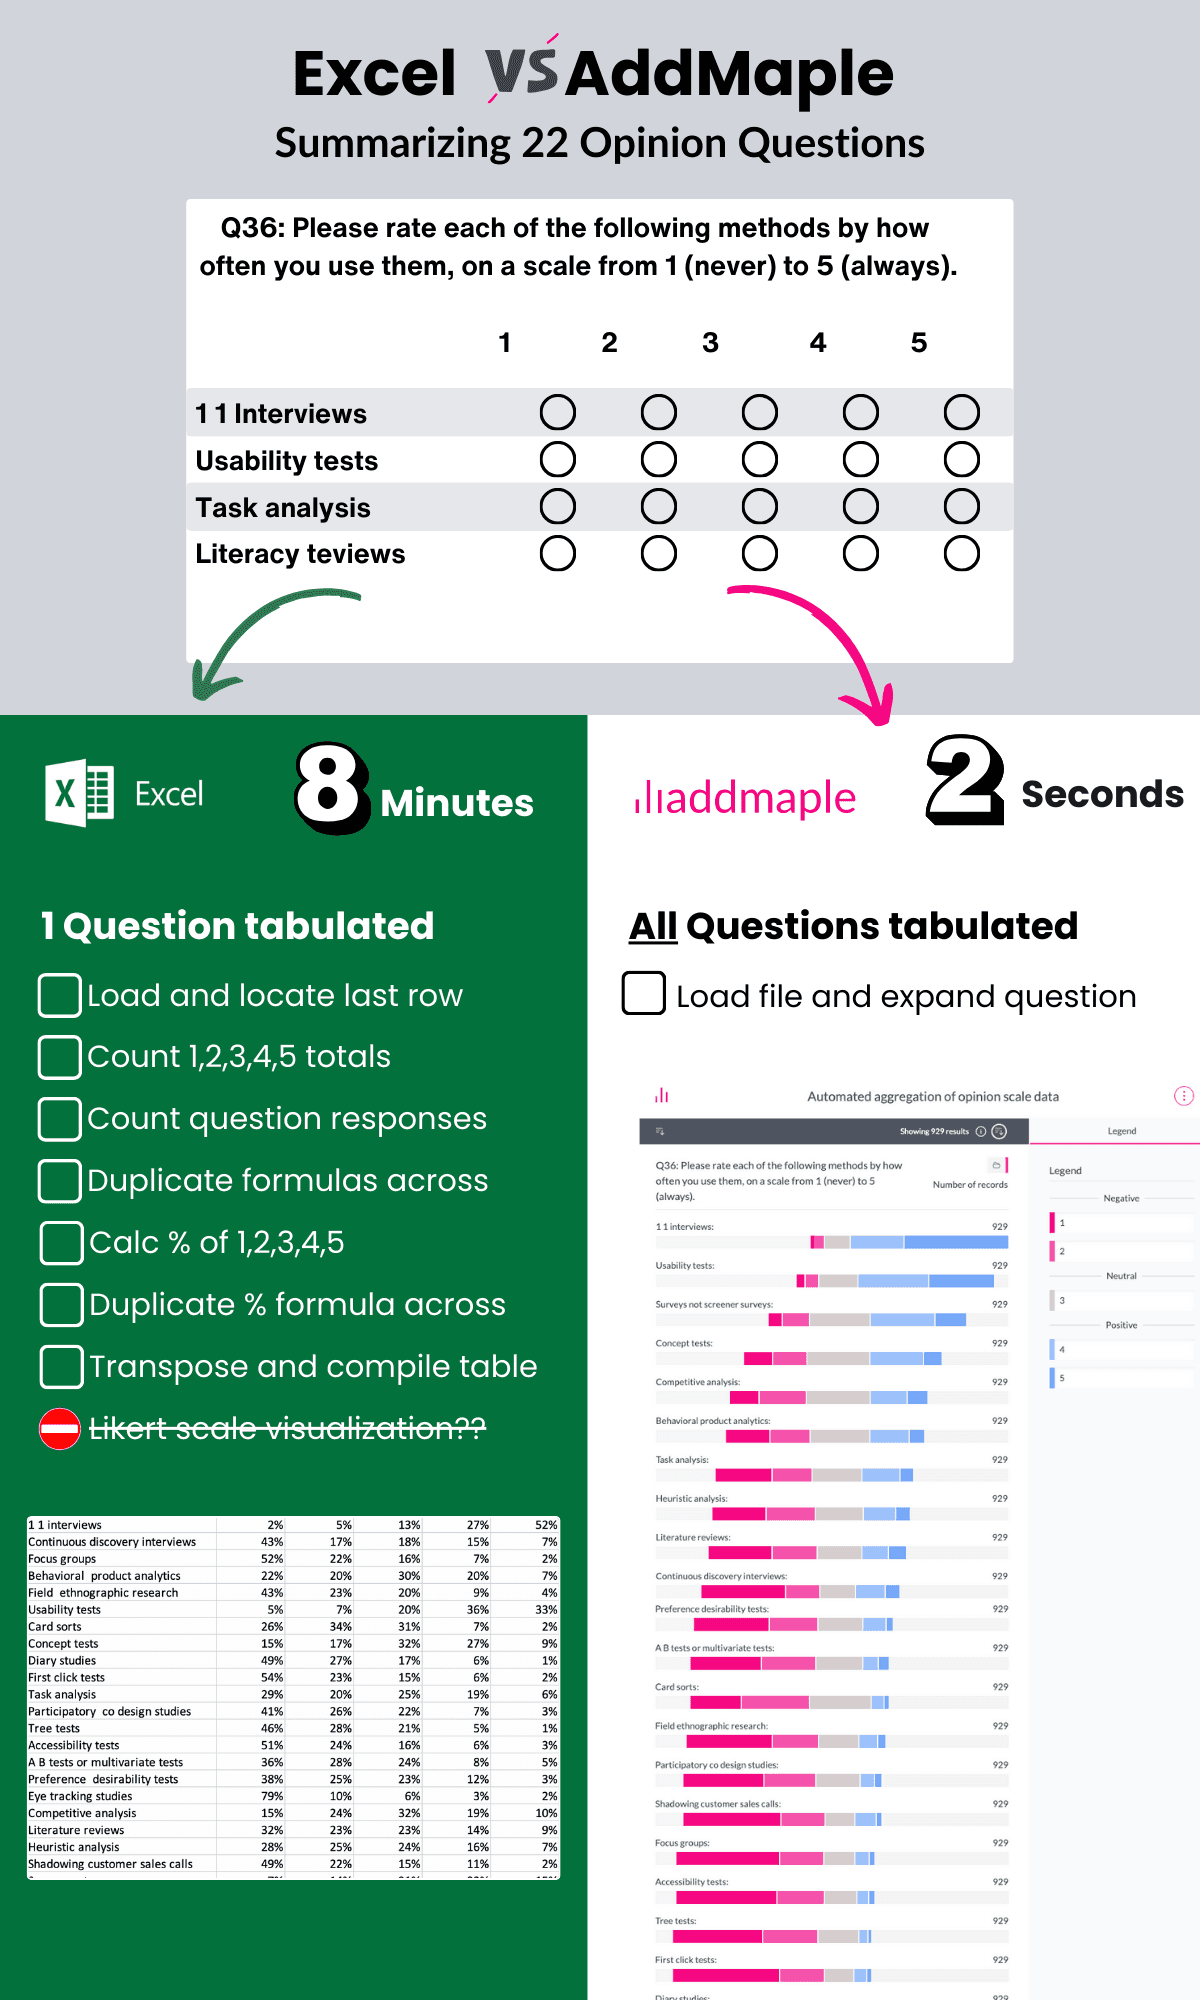
- summarizes double header or matrix columns for comprehensive analysis automatically
- sorts numeric data containing text descriptions, e.g. age categories containing words such as between, younger than, less than, older than etc.
- supports CSV, Excel & SAV (SAV labels and meta data pulled in automatically)
From Raw Data to Explore Data
Secure by design
Your data stays on your system, with all analysis happening instantly in your browser, not in the cloud.
We support cloud based chart and report sharing - but this is optional and fully within your control. Read more about our approach to security and privacy here.
The fastest data analysis tool out there
Built from the ground-up to be super speedy. No more loading spinners, crashing spreadsheets or scrambled sorting.
Don't believe us? Try this Afrobarometer dataset with over 20 million data points fully loaded and summarized in 2.84 seconds
A few of the 20,000+ people cruising from data exports to reports


Ready to Make Your Data Work for You?
See how AddMaple can speed up your survey analysis and help you uncover meaningful insights.
Receive tips for your next data project