Data Reshaping & Visualization
Easily reshape and visualize your data using interactive charts, tables, and customizable views.
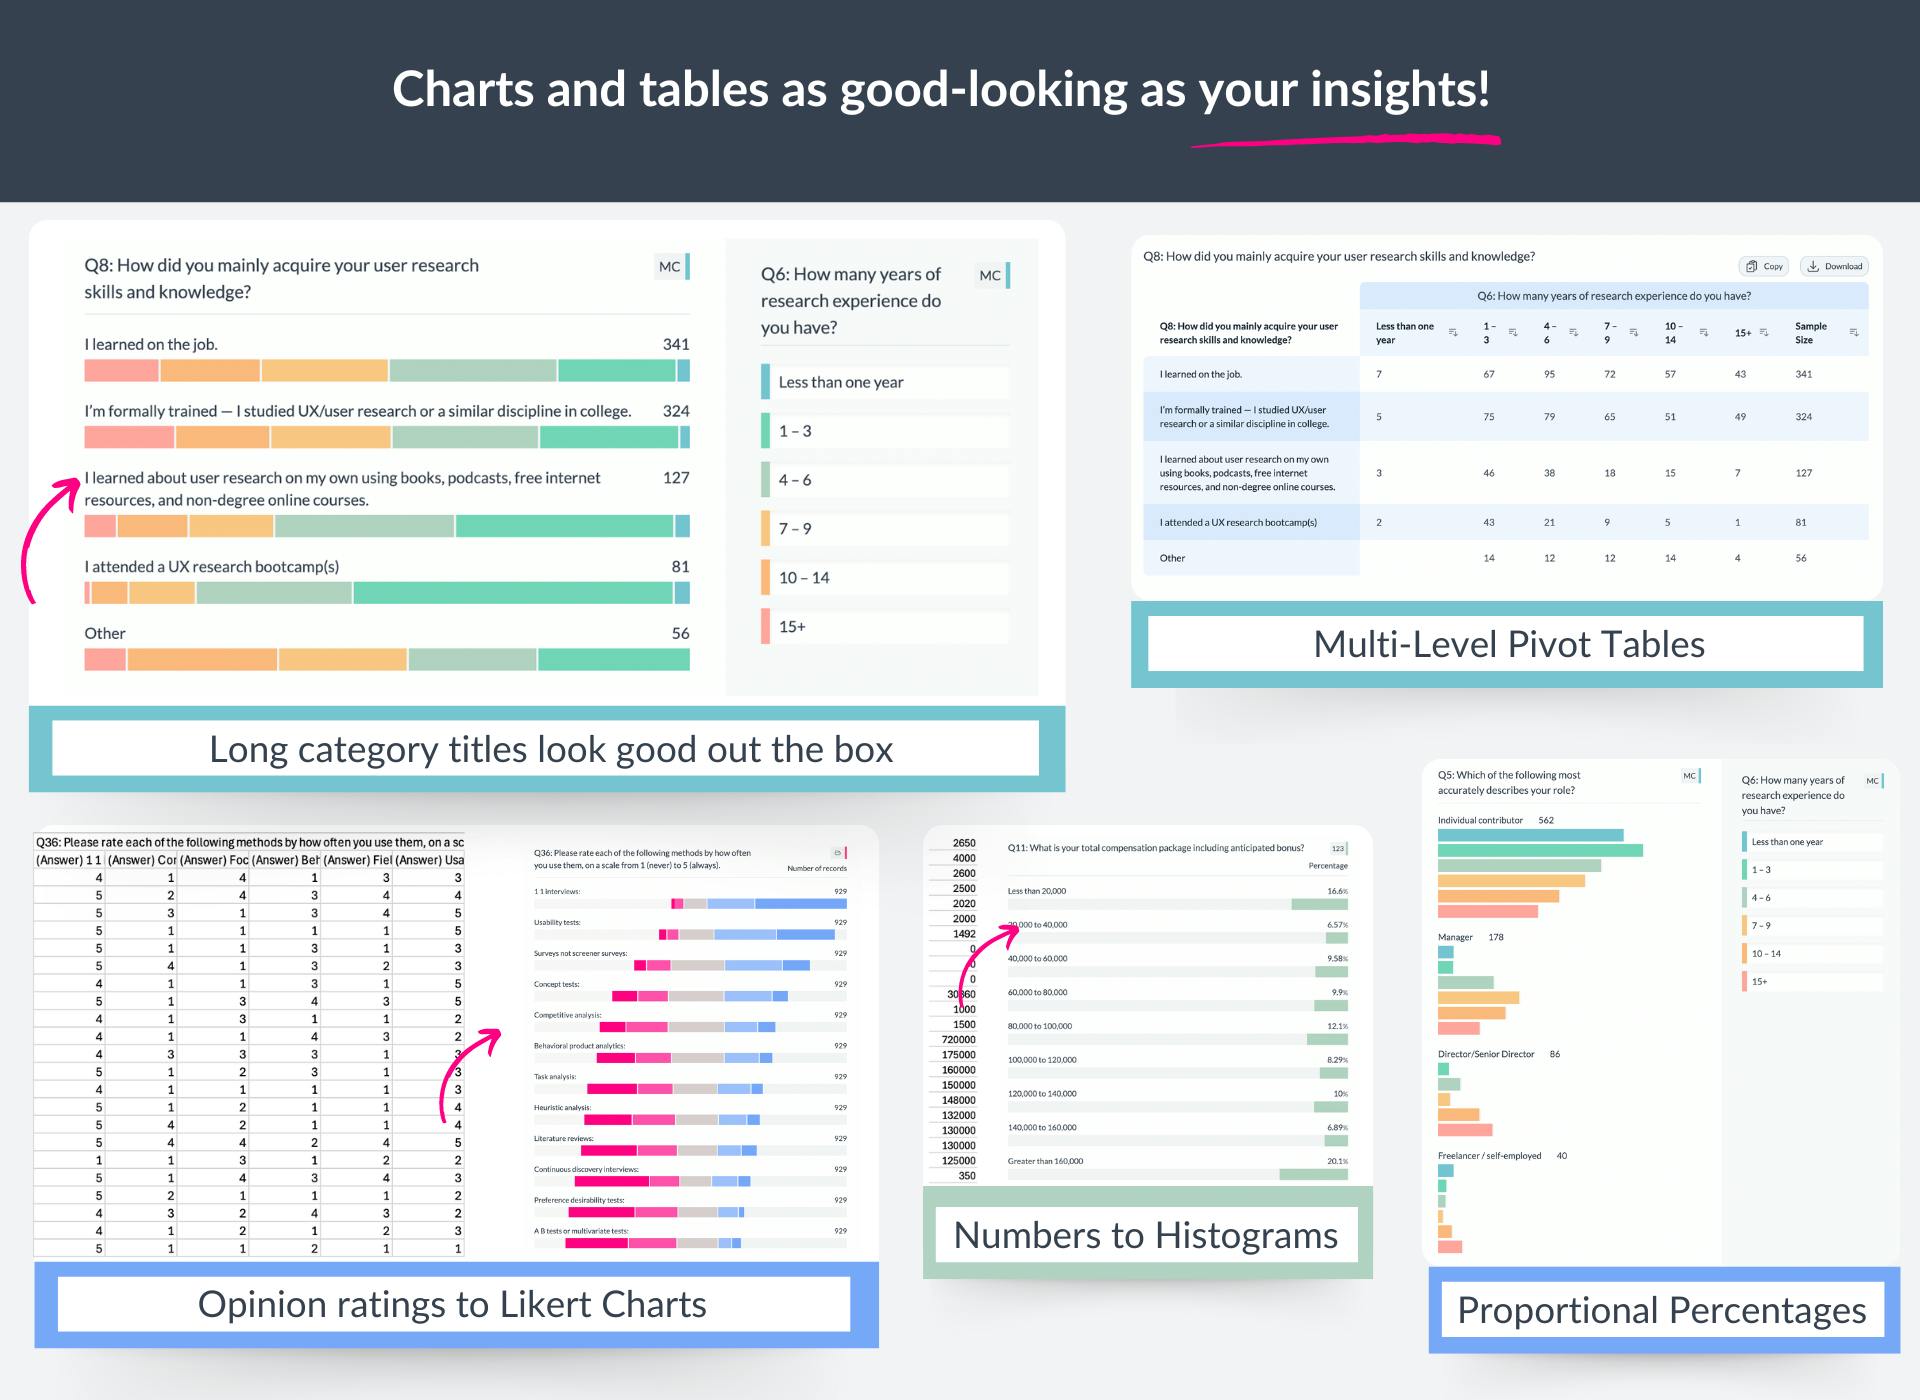
Begin your exploration with interactive charts and tables
-
Raw to beautiful: We automatically summarize & visualize raw data into graphs such as Likert scales, word / phrase frequency, multi-select, histograms & pivot tables.
-
Built for real-world data: All our charts are designed to handle long category titles, multiple encodings, large numbers of categories.
-
**Proportional Percentages: **When pivoting two columns, you can select which column should make up the proportional percentage.
-
Interactive: View data as count, percentage, stacked or bar, neutral or left aligned.
-
View data in a table: Select which columns to include in your table and sort without scrambling your data. Code text in your table without overwriting!
-
**Advanced sorting: **Sort your charts and tables by counts (ascending or descending) or by category titles alphabetically, numerically or alphanumerically.
-
Export as JSON or CSV: Download chart values in various ways for custom visualization work.
Feature Highlights
Instant Data Visualization
Automatically transform raw data into graphs like Likert scales, word clouds, histograms, and more.
Built for Real-World Data
Our charts handle long titles, multiple encodings, and large category sets with ease.
Customizable Views
Switch between counts, percentages, and different chart types with interactive controls.
Flexible Data Export
Download your data in JSON or CSV formats for further analysis or custom visualizations.