
AddMaple won the Paddle AI Launchpad competition out of 77 startups!
AddMaple V3 is here! Learn more
Raw data to instant answers
ONE tool for surveys, verbatims, feedback, metrics, trackers. No waiting for data processing or anything else.
- Beautiful Charts & Dashboards
- AI-Powered Thematic Coding
- Statistical Significance Testing
- Editable Powerpoint Exports
- Excel Data Tables
Our music video explains why we're different
★ Perfect for Beginners and Pros
★ No cloud uploads
★ Transparent Pricing

“I don’t think I’ve ever had a relationship with a software company that was as responsive. I love working in AddMaple. My team loves working in AddMaple. My clients love AddMaple.”
Delivering Insights Shouldn't Take This Long
Most analysis tools aren't built for surveys and feedback. They don't handle "select all that apply" or grids. Analysing a single question takes more steps than it should. Insight discovery hinges on outsourced data table prep, then endless Excel scrolling - hoping to spot what is important.
Too much time lost on data preparation.
Verbatims are either ignored, or analyzed in other tools, losing all links to the quant data.
Spreadsheets break on large files and require endless formulas.
Insights trapped in decks; dashboards out of the question - too slow and costly.
Old-school stats, steep learning curve, one manual test at a time, leaving insights untapped.
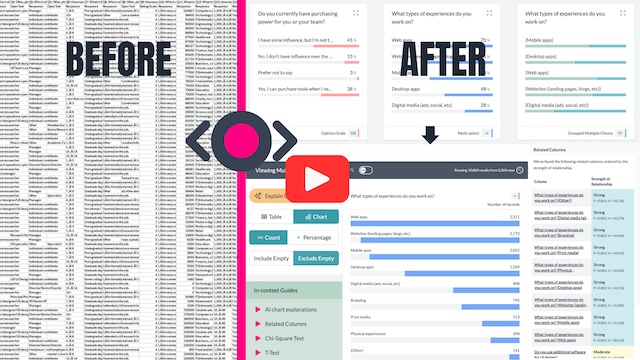
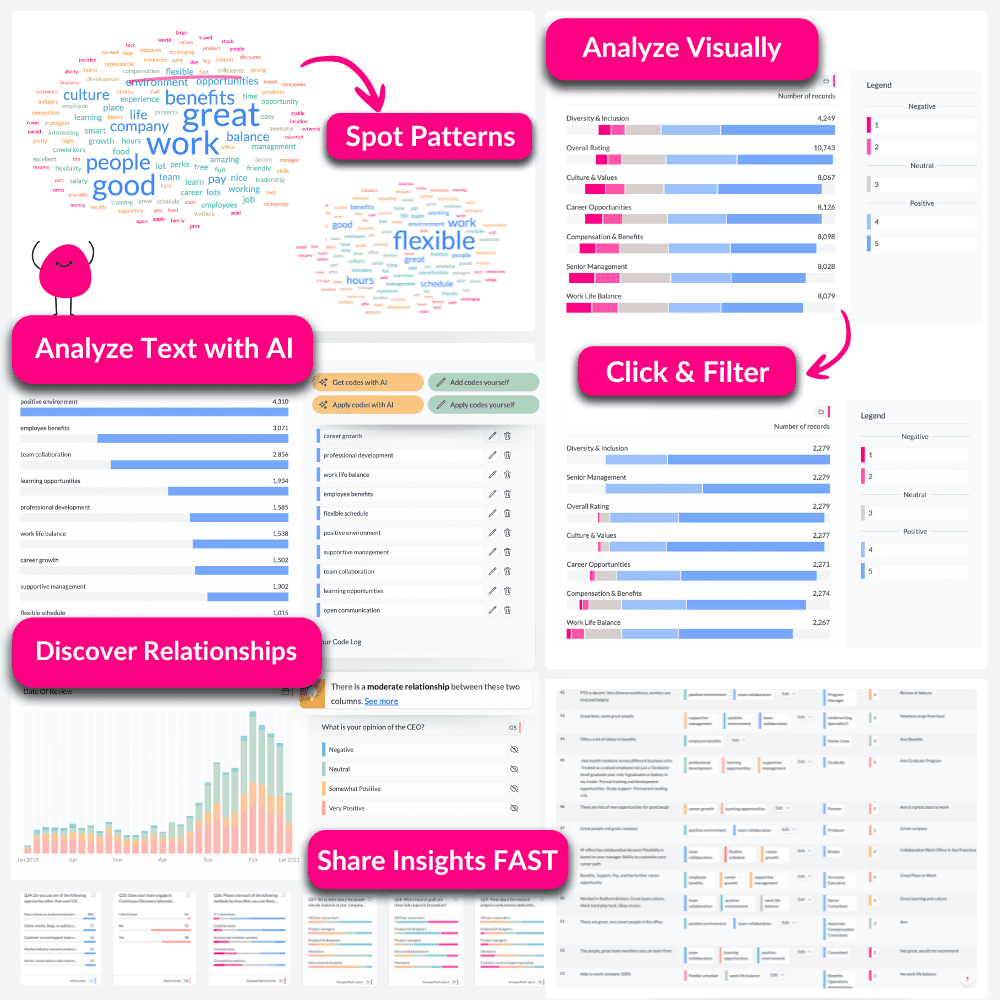
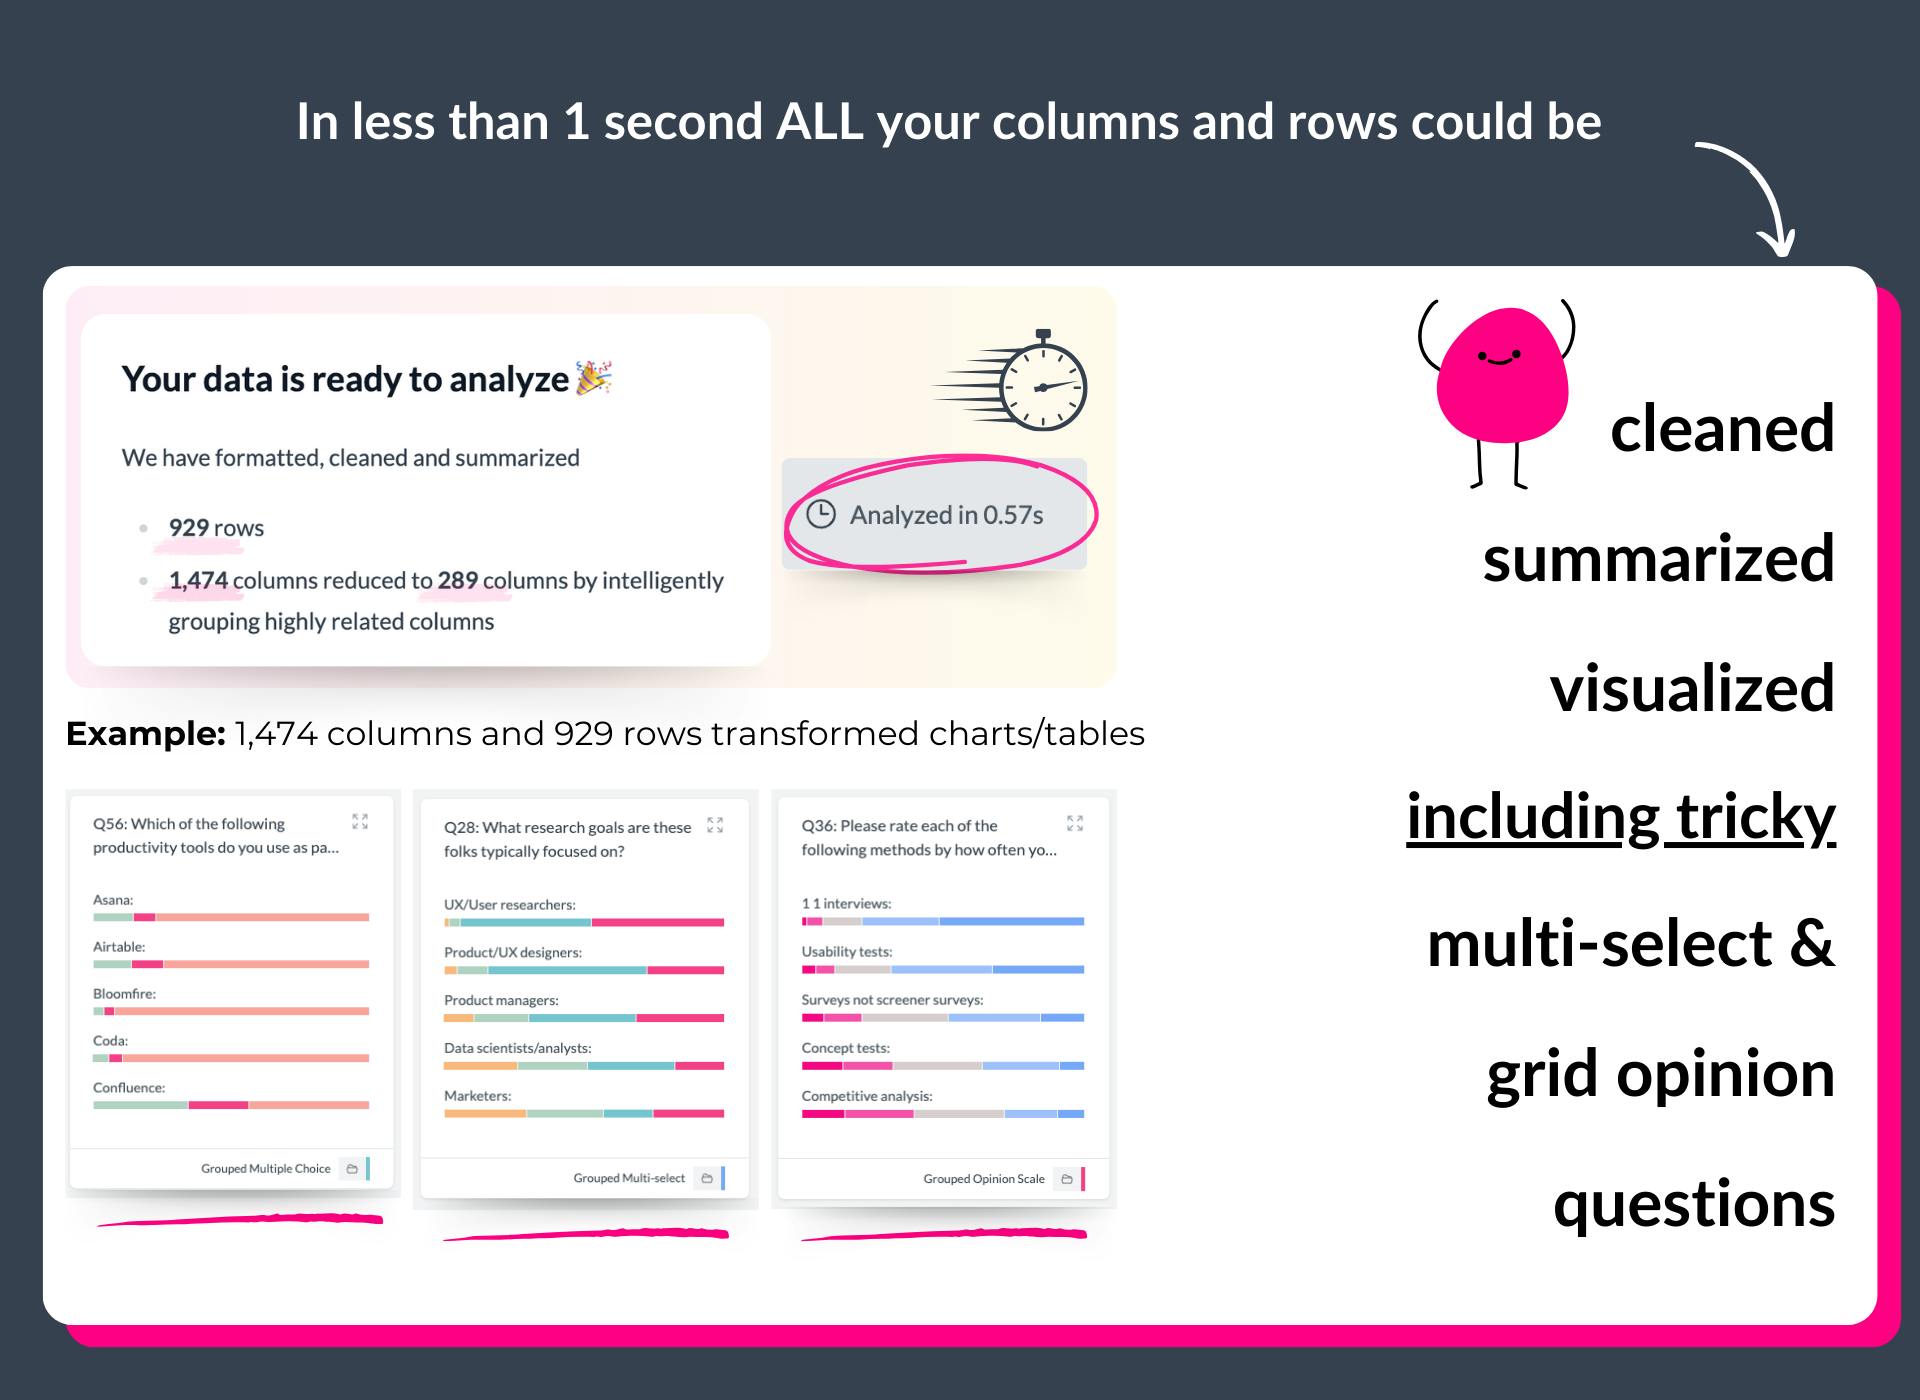
Starts You with Summarised Data
Forget starting with raw columns. AddMaple instantly summarises your data into tables, pivots, and charts. Begin exploring your survey results with answers, not setup tasks.
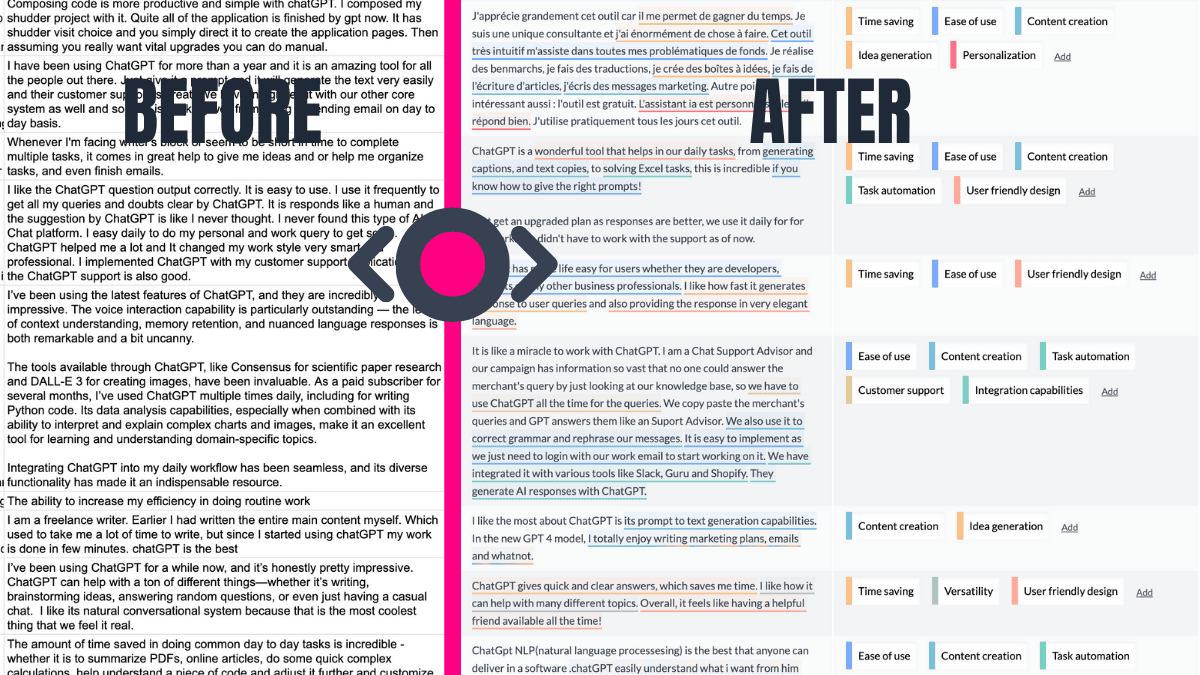
AI-Powered Thematic Coding
Transform open-ended responses into themes, fast. AddMaple's AI not only categorises text but highlights the exact phrases behind each theme. This means you can go from messy text data to meaningful insights with full transparency.
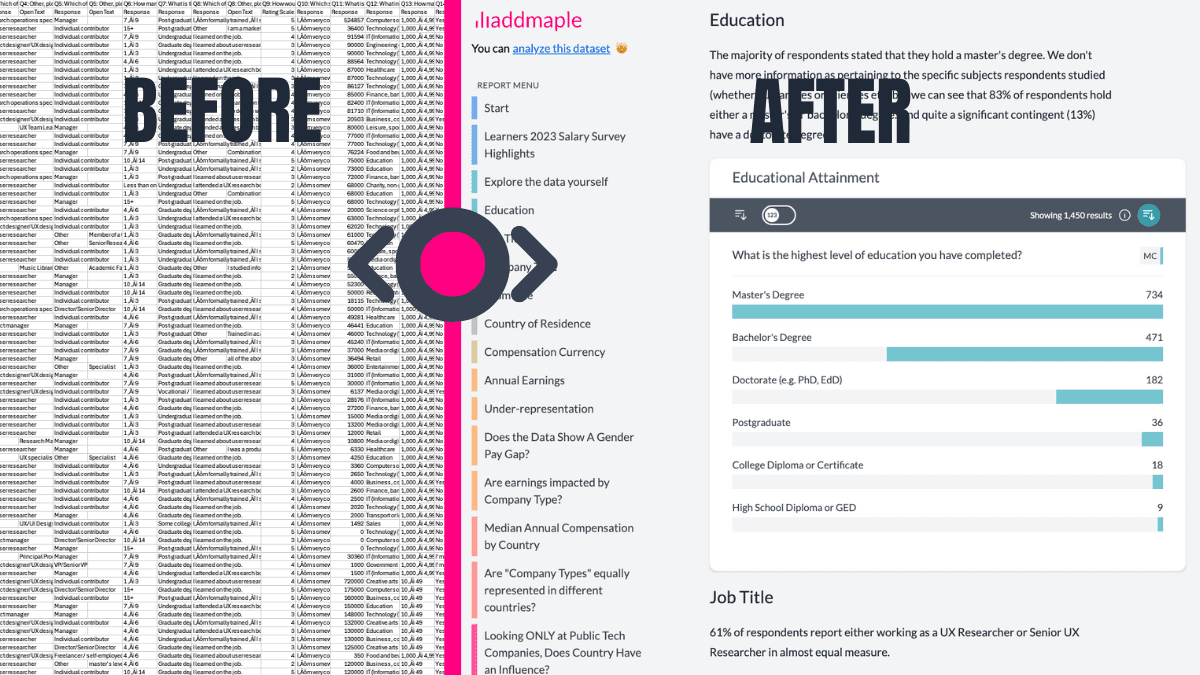
Shares Insights That Live On
Static reports? Not here. AddMaple makes it easy to create Story Dashboards — interactive, shareable stories built from your charts and analysis. Say goodbye to PowerPoint slides that get buried in inboxes—now your findings are explorable and engaging for colleagues and clients.
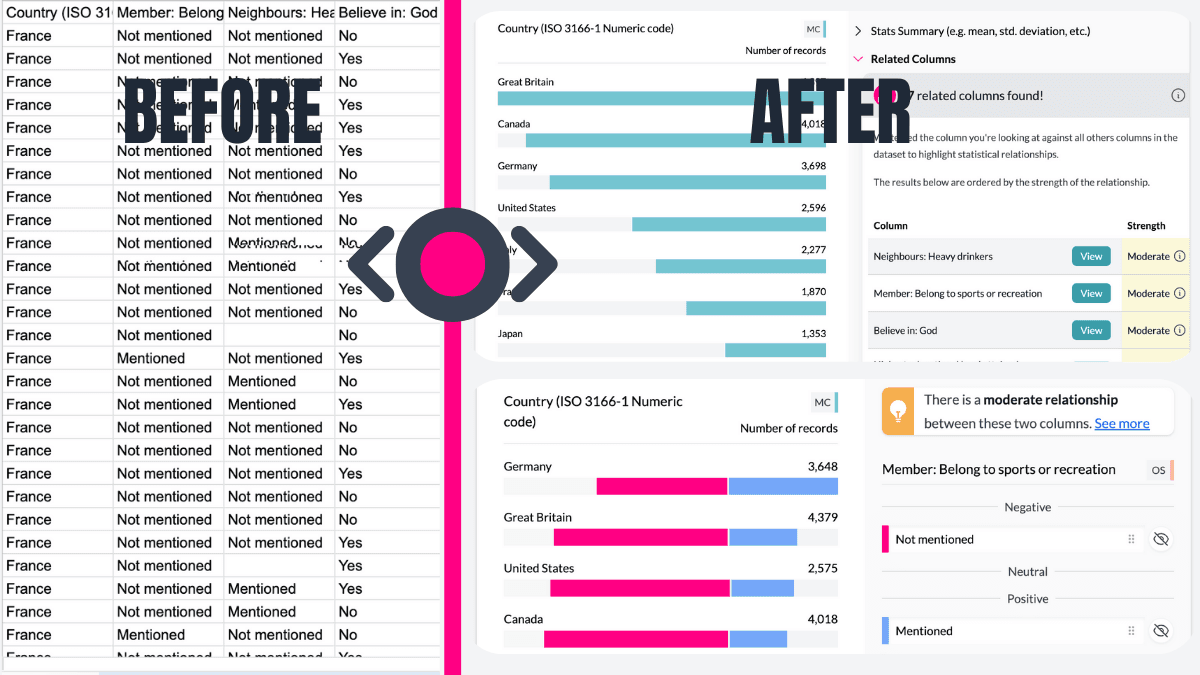
Automatically Reveals What Matters
Find insights faster. AddMaple runs statistical significance tests across all columns—including AI-generated themes—and ranks relationships by importance. This means you're instantly guided to the patterns and trends that matter most.
Handles Dates and Numbers with Ease
AddMaple takes the frustration out of analysing dates and numbers. It detects date ranges for you, enabling easy segmentation by time period. For numeric data, AddMaple creates histograms and grouped ranges right away, so you can uncover patterns without spending hours on setup.
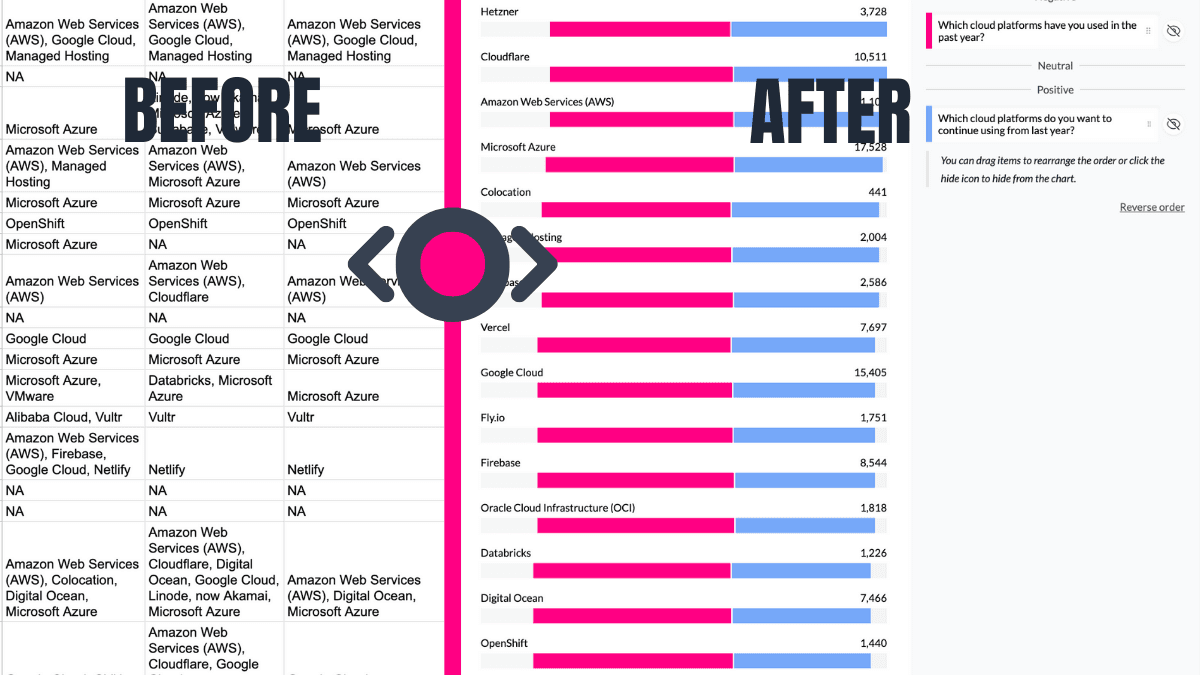
Automates Multi-Tag Analysis
Handling "Select all that apply" or multi-tag columns? AddMaple automatically detects these, summarises them into clear visual charts, and skips the hassle of manual column-splitting or formulas.
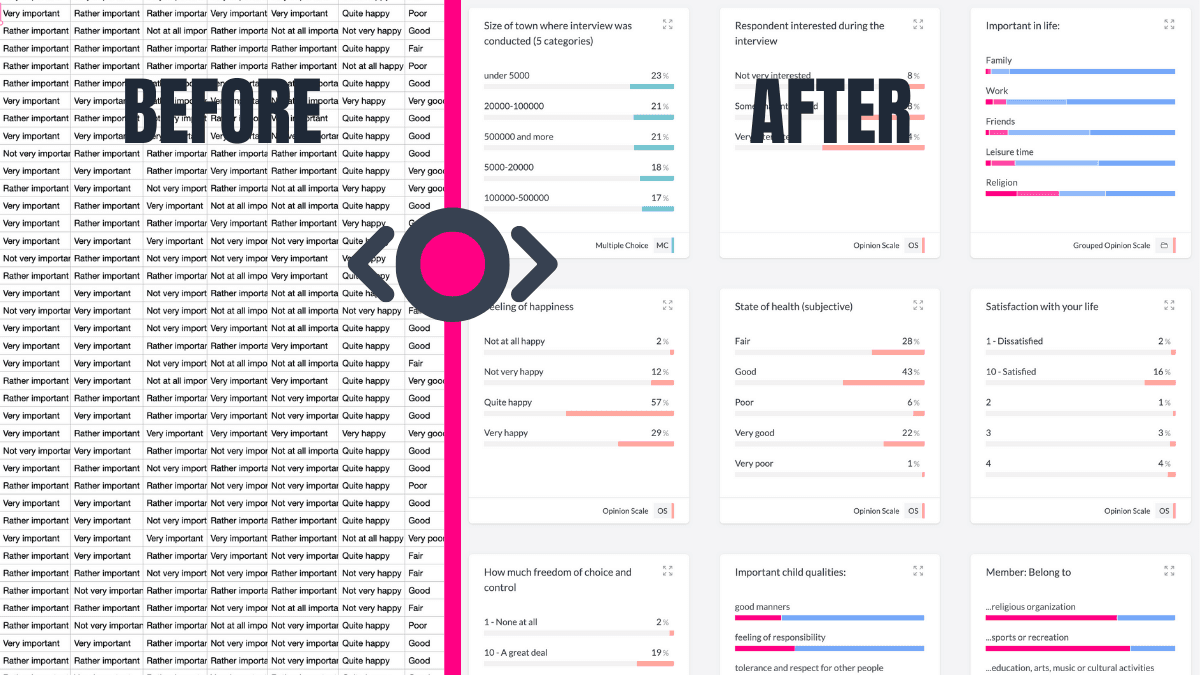
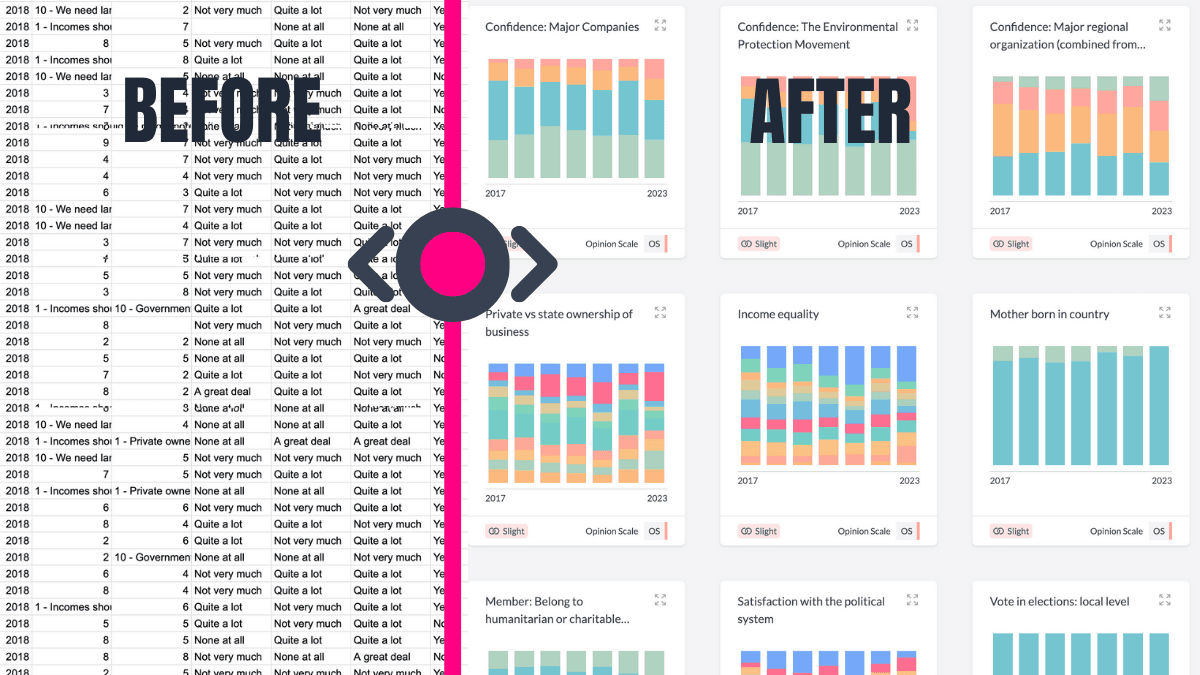
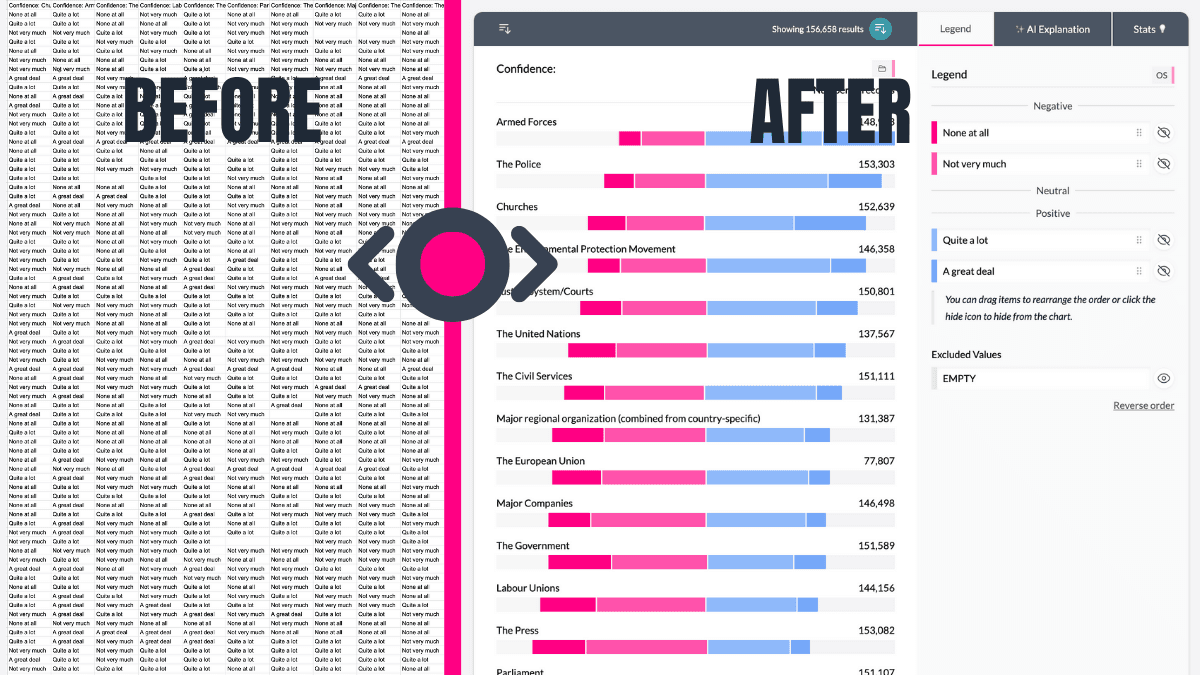
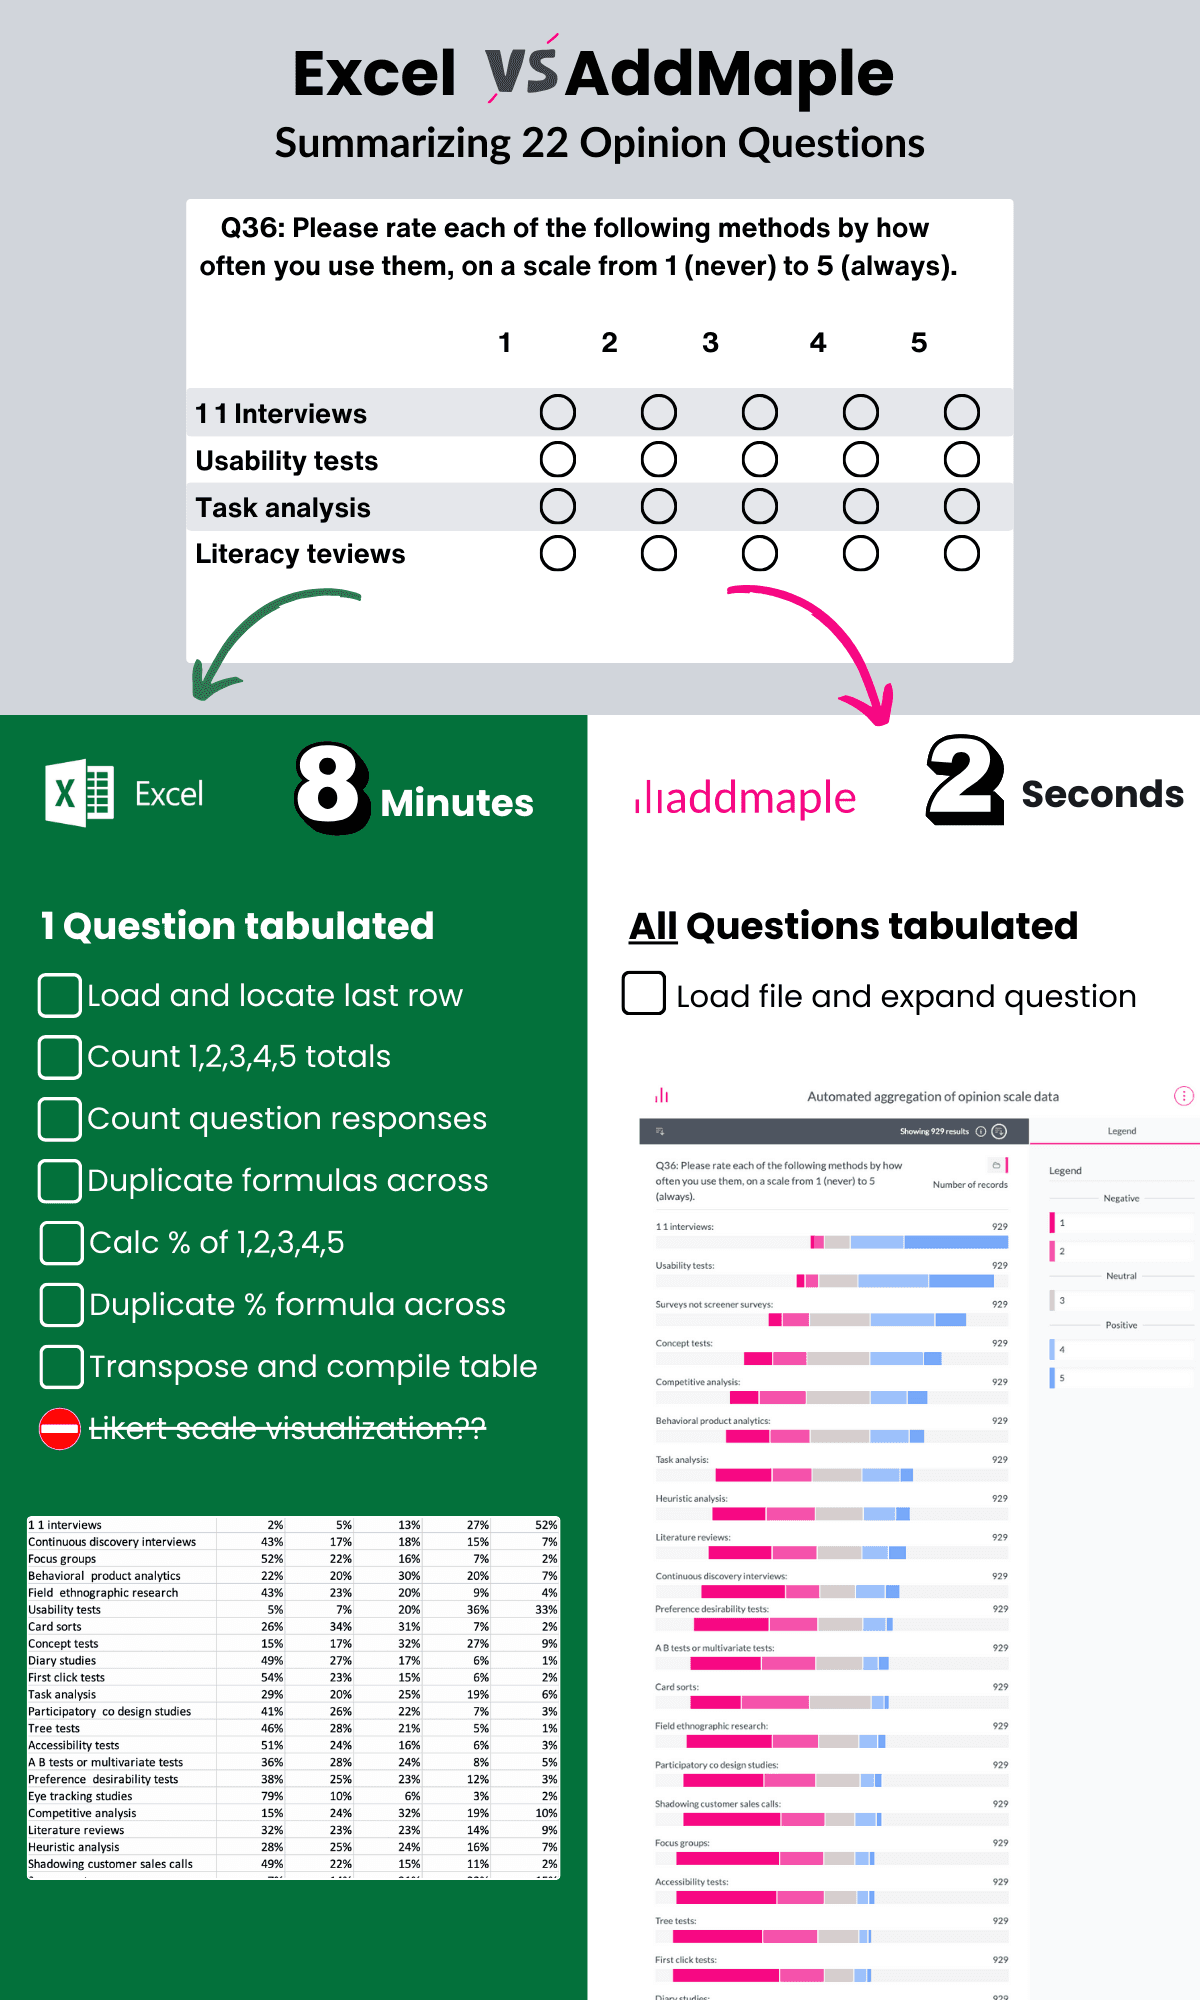
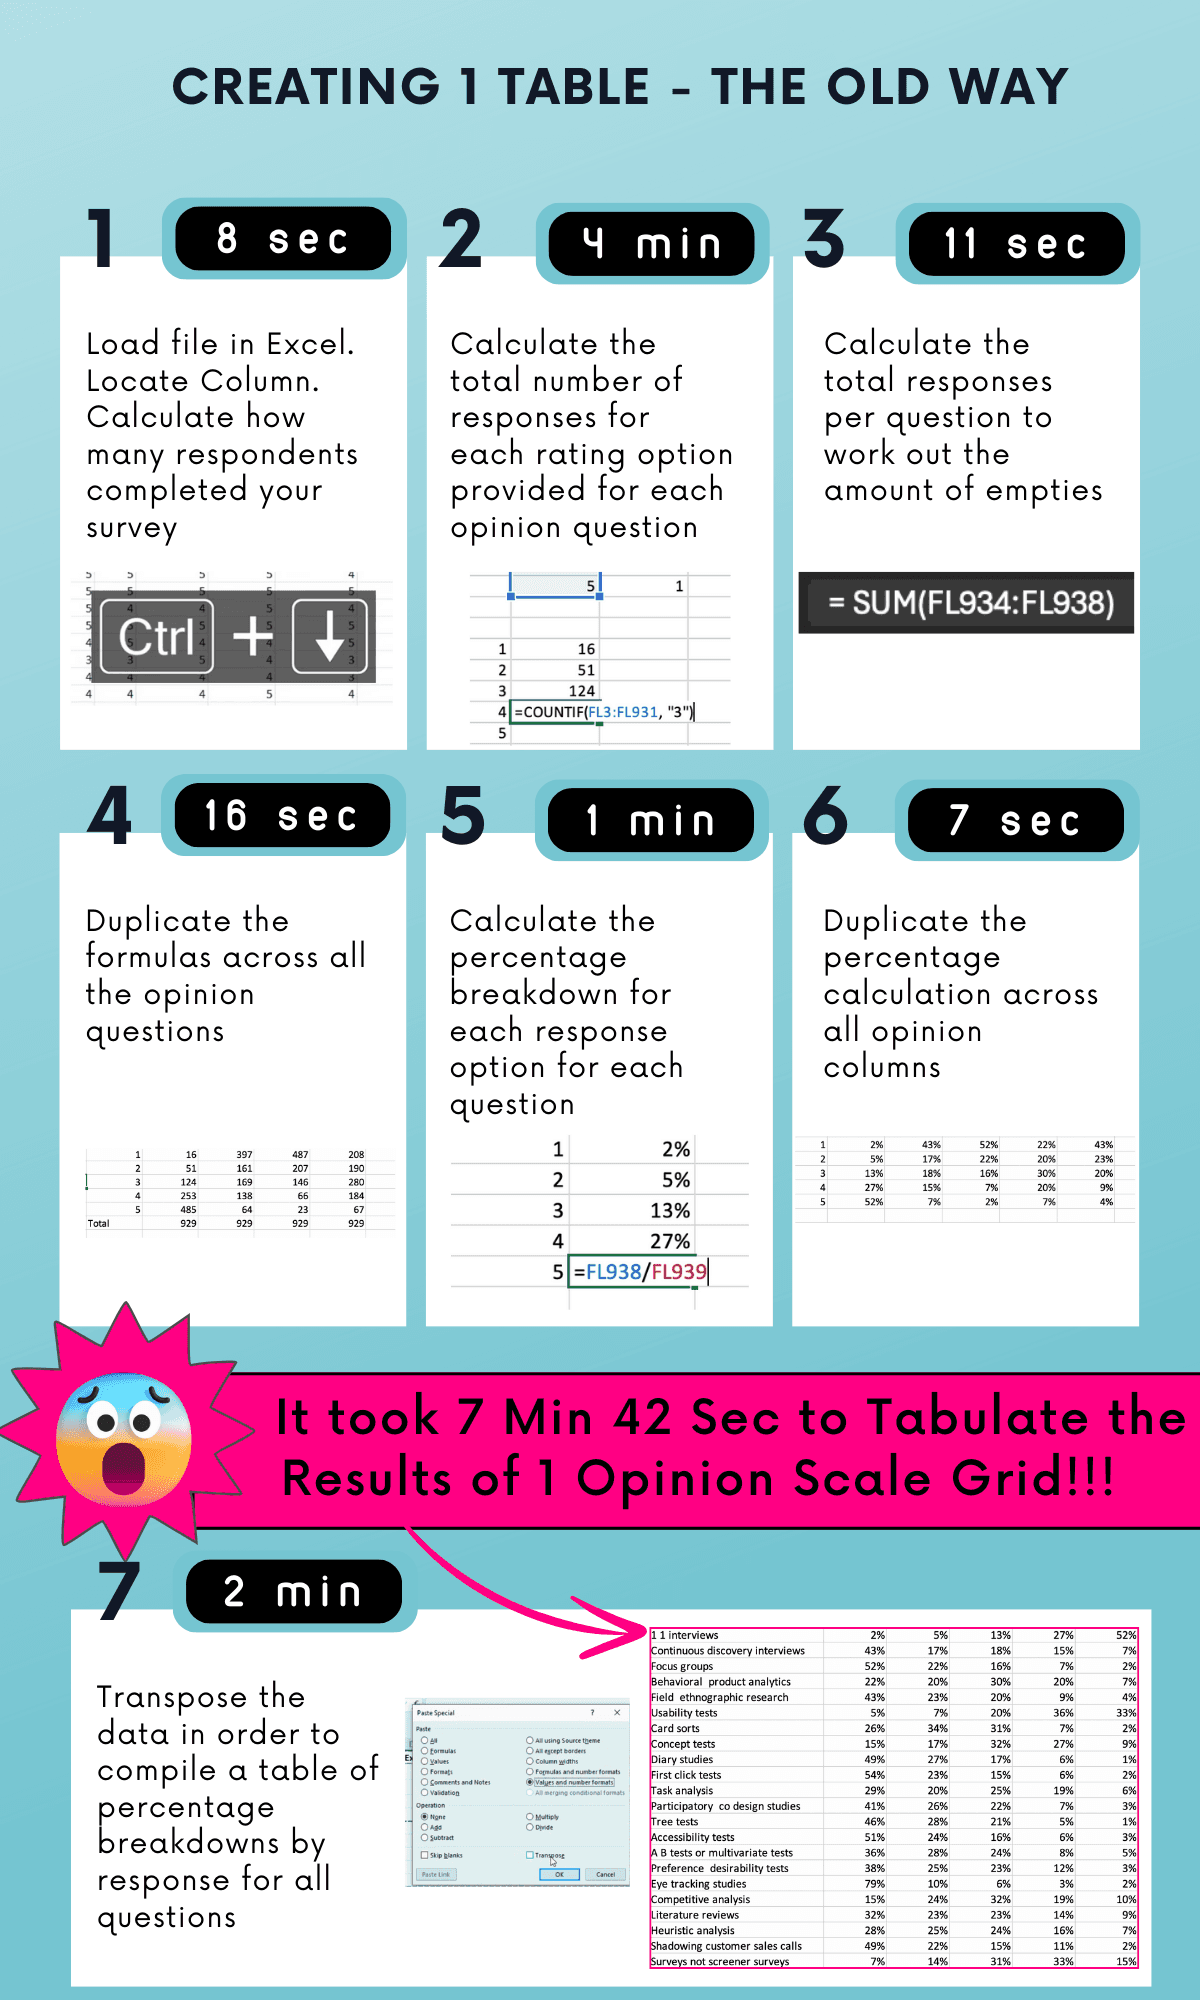
Turns Likert Scales Into Pivot-Ready Visuals
AddMaple takes your Likert-scale questions to the next level with elegant, neutral-aligned charts. Instantly see where opinions fall, then pivot by any other column—like demographics or preferences—to dig deeper into your data.
Integrations
Bring your data to us from any platform and get an instant explore-ready dashboard


AddMaple creates instant chart dashboards that let you analyze your survey data visually and is one of the best ways I've found to conduct AI-powered thematic analysis of open-ended results.


AddMaple: From Raw Data to Insights in Seconds
Cut down the time from raw data to insights you can share.
AddMaple combines an explore-ready dashboard, a powerful stats engine, and explainable AI to help you make data-driven decisions - no data wrangling required.
Analyze Open-Ended Questions with AI
We enable you to thematically code tens of thousands of open-ended responses in minutes not days. This data can then be further analyzed, visualized and explored with our powerful quant features.
Qual and Quant in One
Combine quantitative metrics with qualitative feedback in one platform, giving you a complete view of your survey data.
No Data Wrangling Needed
Bring your data from anywhere, AddMaple will generate an explore-ready dashboard in less than a second. No data cleaning or prep needed.
Share Findings That Stick
Stop burying insights in PowerPoint slides that get lost in email inboxes. Create interactive dashboards and shareable stories that let your audience explore the data themselves—keeping findings fresh, findable, and actionable.
Interactive Stories, Not Static Reports
Transform raw insights into explorable narratives. Your stakeholders engage with data at their own pace, discovering the story behind the numbers.
Updates That Live Forever
Dashboards update automatically when your data changes. No re-sharing, no outdated versions floating around—everyone always sees the latest insights.
Built in Minutes, Not Days
From raw data to polished dashboard in minutes. Your analysis is instantly ready to share—no designer, no developer needed.
Features to keep you in flow
AddMaple automates data structuring and cleansing because it:
- handles empty cells grouping them off, bypassing the need for placeholder values
- identifies and summarizes diverse data types: numbers, currencies, dates, text, survey questions, duration, multiple choice, multi-select, matrix, opinions, grid questions and more
- recognizes data patterns: multi-select tags, word and phrase clusters within text responses, numeric data distribution and more
- buckets numeric data into appropriate bins based on their range and distribution, while identifying and restricting the impact of outliers
- summarizes double header or matrix columns for comprehensive analysis automatically
- sorts numeric data containing text descriptions, e.g. age categories containing words such as between, younger than, less than, older than etc.
- supports CSV, Excel & SAV (SAV labels and meta data pulled in automatically)
From Raw Data to Explore Data
Secure by design
Your data stays on your system, with all analysis happening instantly in your browser, not in the cloud.
We support cloud based chart and report sharing - but this is optional and fully within your control. Read more about our approach to security and privacy here.
The fastest data analysis tool out there
Built from the ground-up to be super speedy. No more loading spinners, crashing spreadsheets or scrambled sorting.
Don't believe us? Try this Afrobarometer dataset with over 20 million data points fully loaded and summarized in 2.84 seconds
A few of the 20,000+ people cruising from data exports to reports


Ready to Make Your Data Work for You?
See how AddMaple can speed up your survey analysis and help you uncover meaningful insights.