Analyze Your Data From A File
How To AddMaple automatically analyzes your data from a file and generates charts for you.
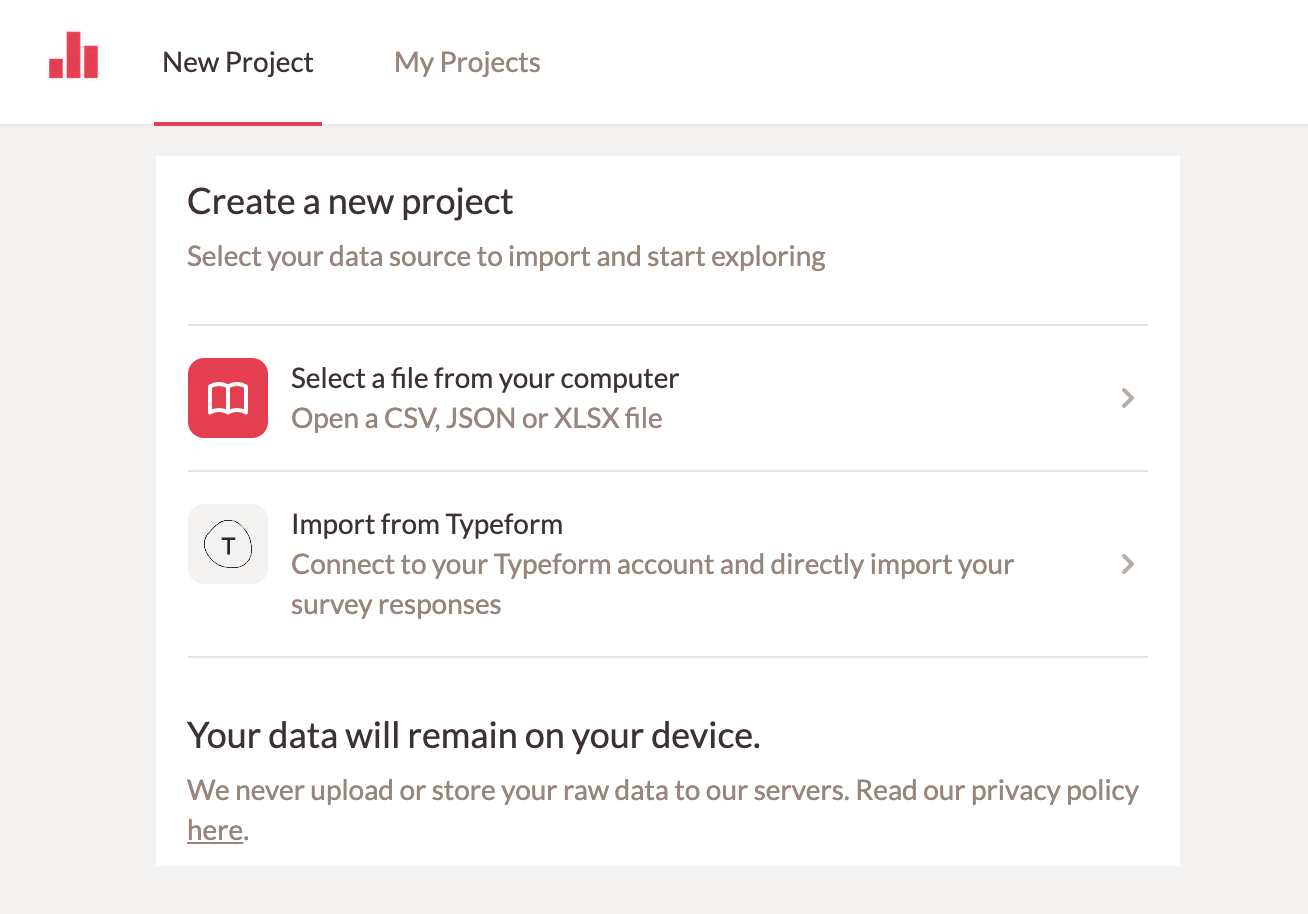
We support CSV, XLSX and JSON files. If you have your data in another format, please convert it to CSV in order for us to analyze it.
1. Sign In
Sign in via the top right "Sign In" link using either your Google account or a username and password.
2. Select a file for AddMaple to analyze from either
Your computer: CSV, JSON or XLSX
A URL: CSV, JSON or XLSX file embedded in a URL
Survey platforms: Connect directly to Typeform, SurveyMonkey, or Tally - no need to download your survey first

Click "Select a file from your computer". This will bring up a file chooser screen that will allow you to navigate the file system to find a file to read and analyze.
Once you have selected a file, AddMaple will immediately start reading and analyzing it. This could take a few seconds depending on how large your file is.
Please note, your data is never uploaded to AddMaple, it stays on your computer
Step 3. Explore your data
Once AddMaple has read your file you will see the explore screen:

This screen show some statistics on your data file. In the example above AddMaple found 61 columns and 64,461 rows. The reading and analysis took 7.95 seconds.
You can now start exploring your data, pivoting, filtering and creating shareable reports.
If there is a problem reading your file or if it looks like AddMaple hasn't understood your data, please click the "?" icon in the bottom right and send us a message.
![]()
