Use Analysis Agent
The analysis agent helps you explore your data by answering questions and providing insights about your charts and datasets.
Opening the analysis agent
Click the ? button in the bottom-right corner of your dashboard (or top-right if you're in dashboard mode).
1Click the help button to open the chat panel.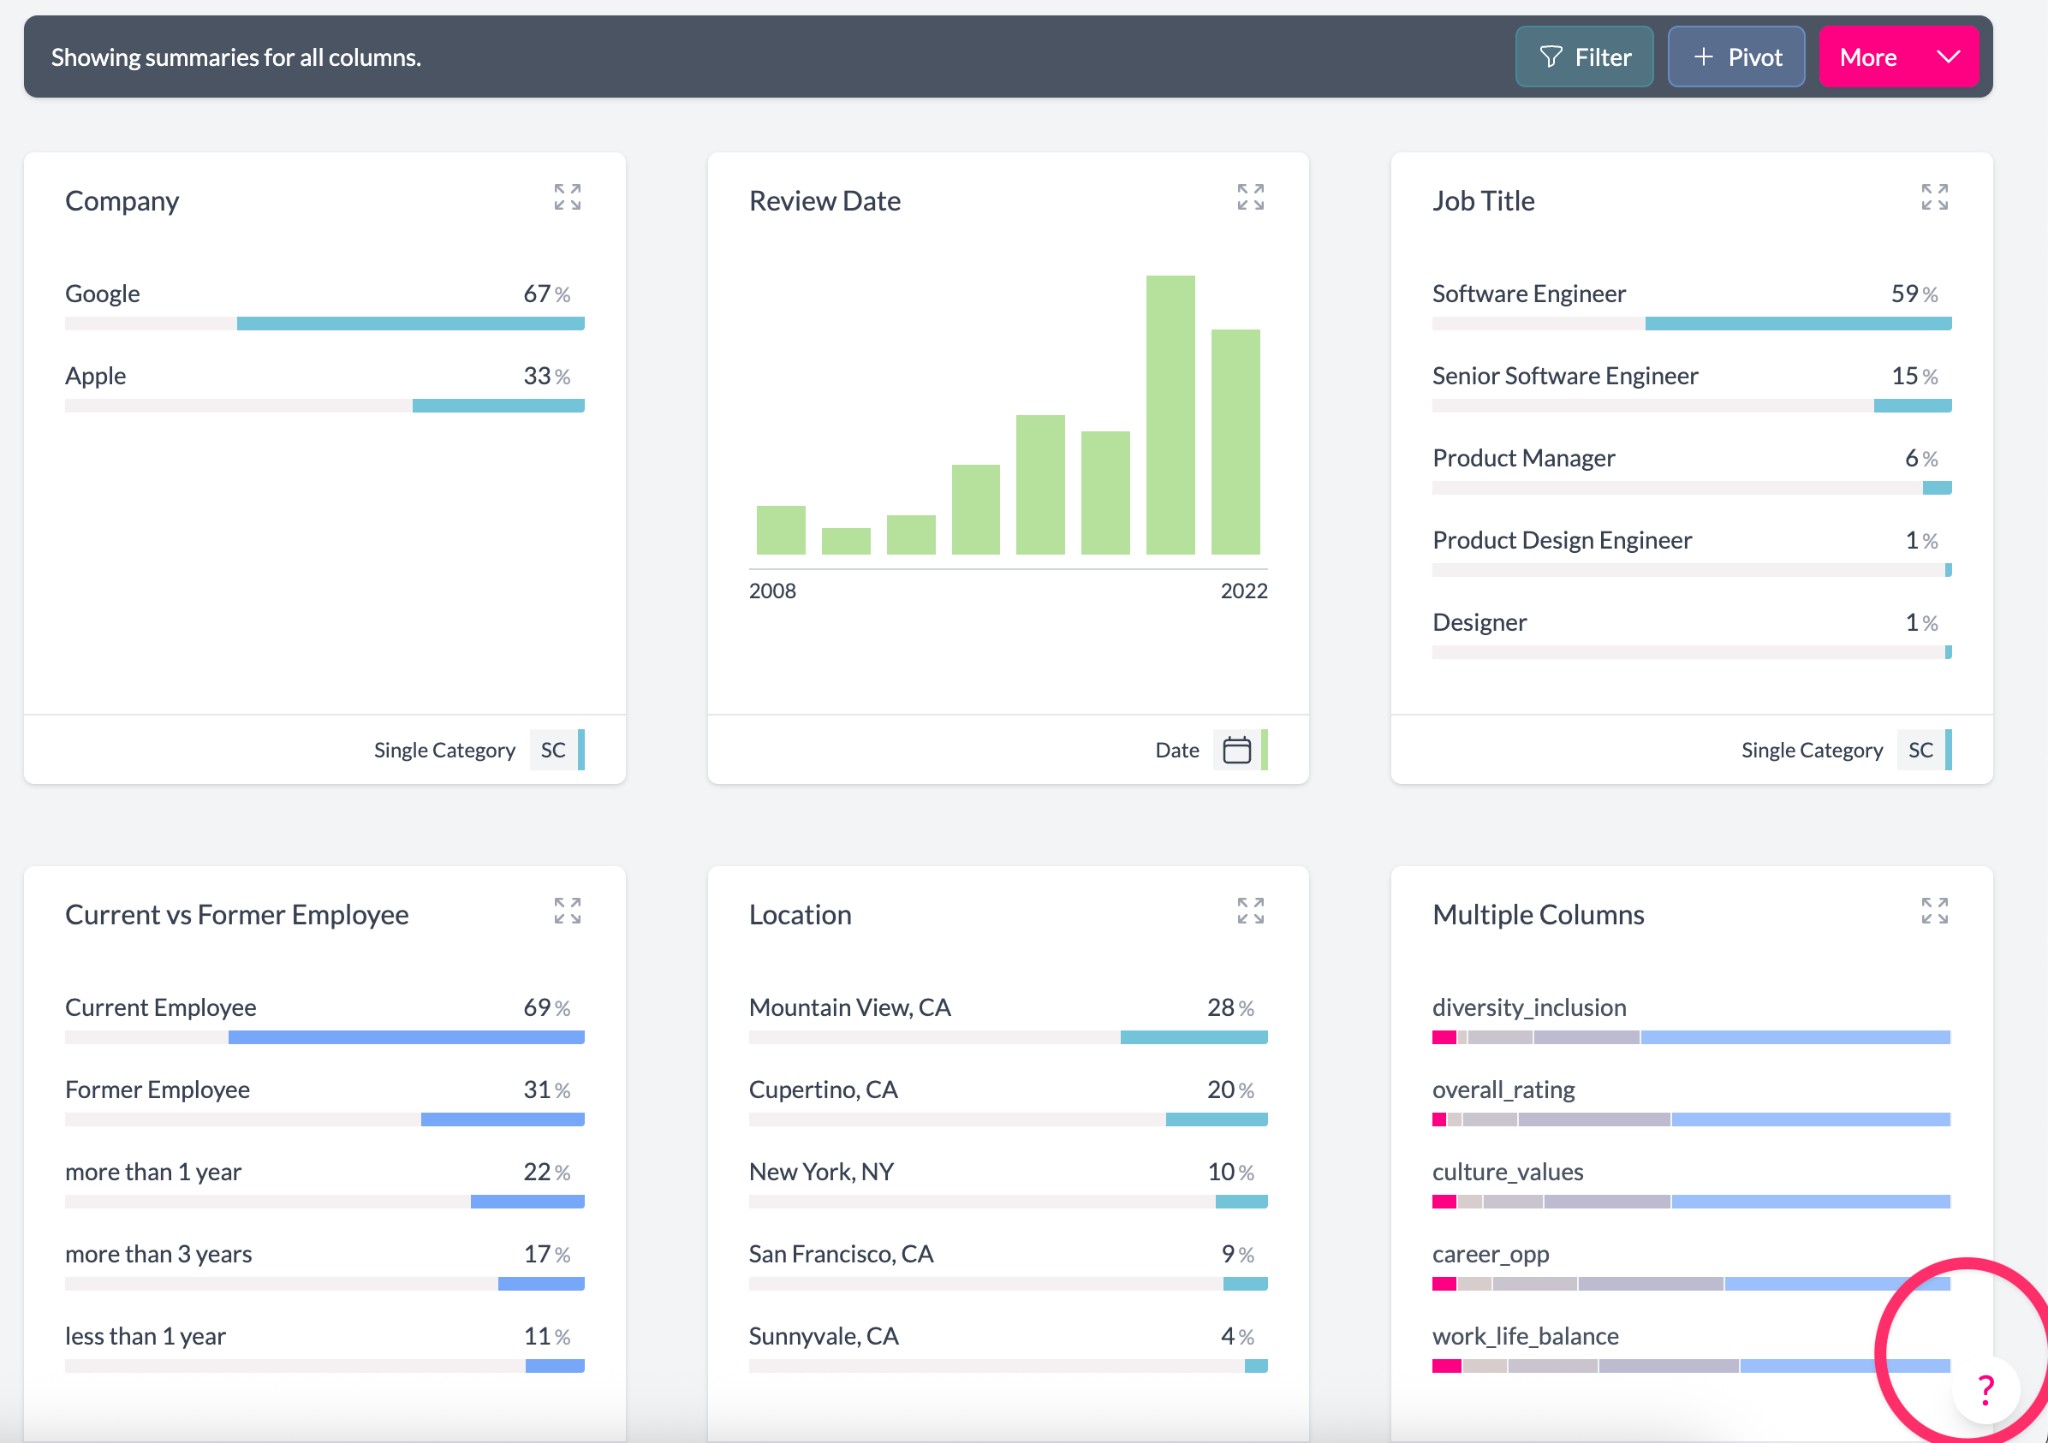
In the panel that opens, click New conversation and select New analysis.
2Click New conversation and select New analysis to start an analysis chat.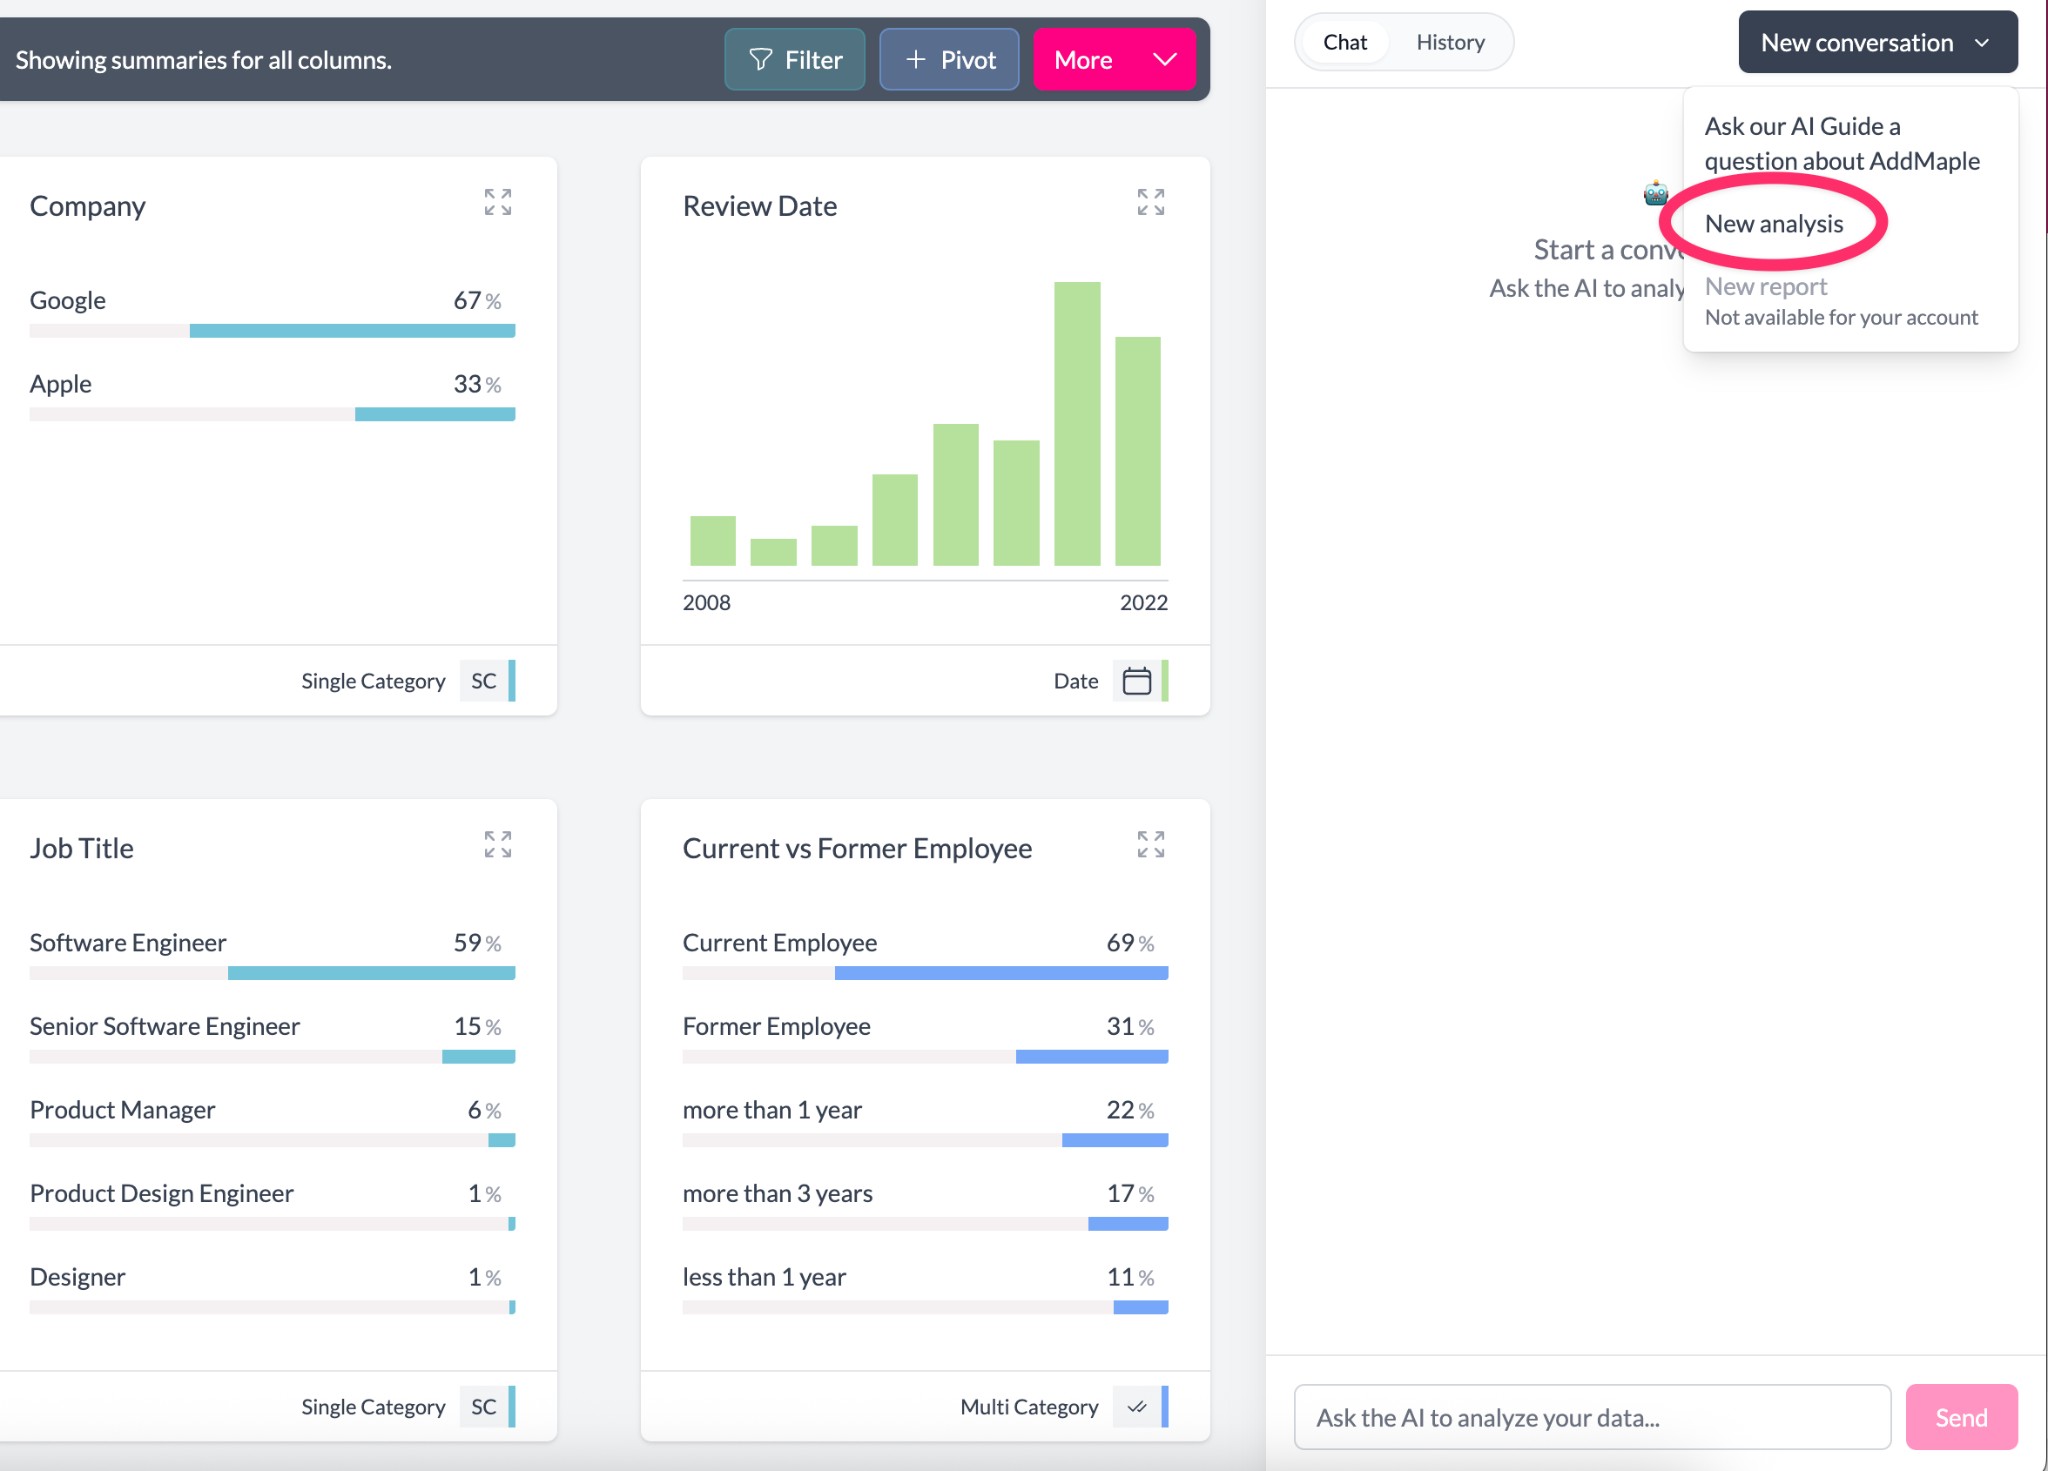
If you don't see the analysis option, make sure you have a project with data loaded and that the analysis agent feature is enabled for your account.
Once you've started a new analysis conversation, you can begin asking questions about your data.
3The analysis chat interface ready for your questions.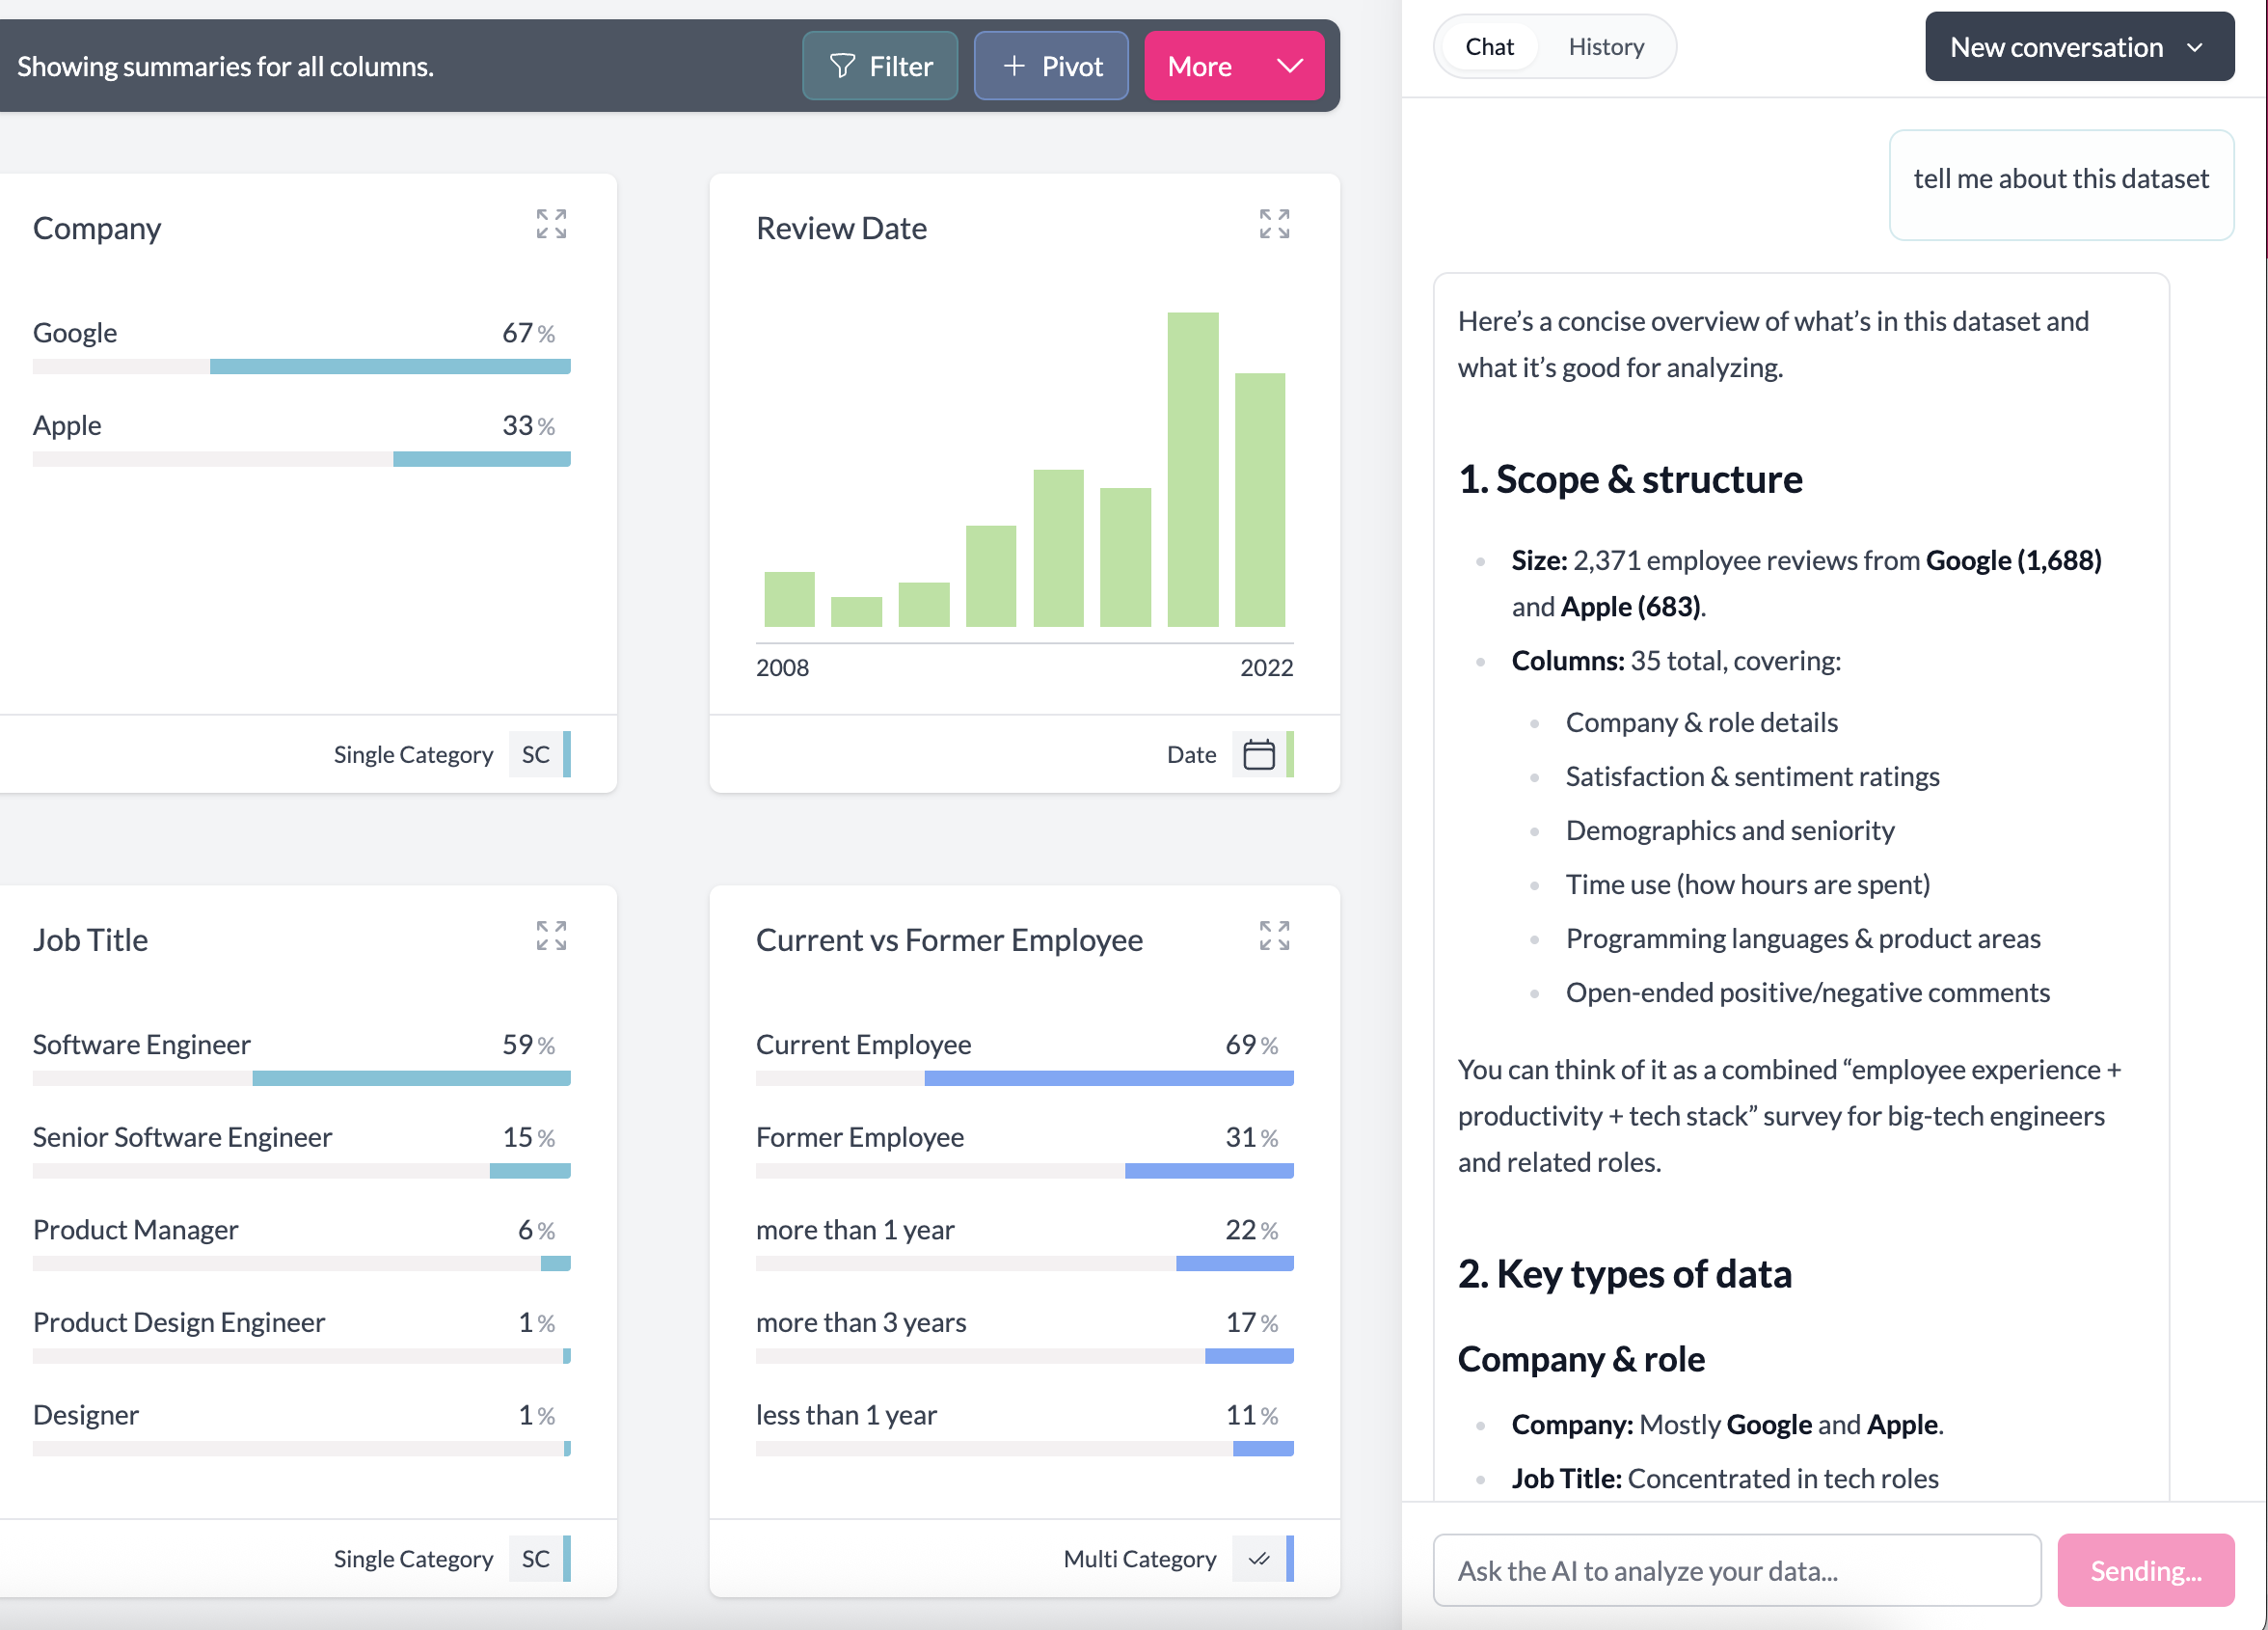
Types of questions you can ask
Descriptions and summaries
- "What stands out in this chart?"
- "Summarize the key differences between segments"
- "What are the main patterns in the satisfaction data?"
Comparisons
- "Compare satisfaction between Region and Product line"
- "Which segments over-index on Positive responses?"
- "How does NPS differ across customer segments?"
Trends and patterns
- "Describe any notable trend over time for NPS"
- "Highlight spikes or drops in this metric"
- "What patterns do you see in the response rates?"
Key drivers and relationships
- "What factors predict low satisfaction?"
- "Find key drivers of intent to buy"
- "Which columns are most related to customer retention?"