How to create custom columns/variables
AddMaple allows you to create new custom variables with your own categories. These can be as simple or as complex as you need. You can create fine-grained personas from multiple filters or just create a simple single-filter category.
- Open the custom variable builder — Click More and select Custom Column/Variable.
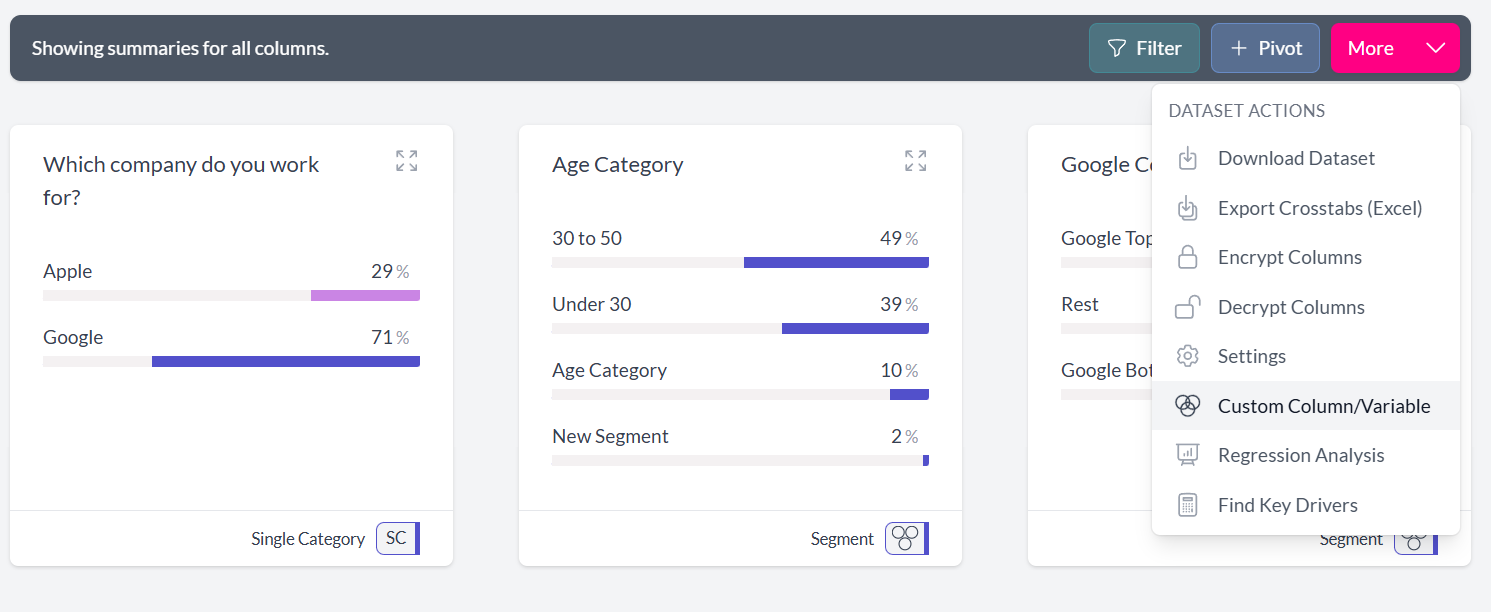
- Name your column and choose a category type — This opens the Create a new Custom Variable or Column screen. Give your new column a name, then choose whether categories overlap.
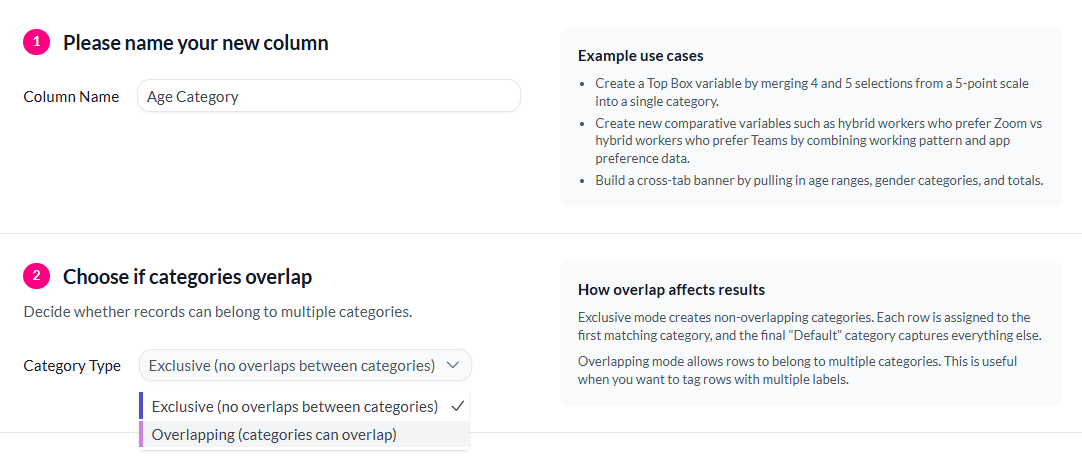
To overlap or not?
AddMaple supports two modes for custom variables.
Exclusive (no overlaps between categories) — In this mode each category is distinct from the other. AddMaple calculates each category one by one and ensures that a record is only added to the first category that it matches. This is the most common way of working and the end result is equivalent to a "multiple choice" column.
Overlapping (categories can overlap) — In this mode, categories can overlap. This is useful if you are comparing multiple personas that are not completely distinct. The end result is equivalent to a "multi-select" column where each record can be assigned to multiple categories.
In exclusive mode you will notice that there is a special category at the end with the default name Default. This category contains all records that weren't matched by any of the categories. If you want to ignore these records in your analysis you can simply filter them out when pivoting and exploring.
- Build your categories — Add categories using data rules from across your dataset. As you add rules, AddMaple recalculates the number of matched records for each category in real time. Any records not matched will be added to the final Default category.
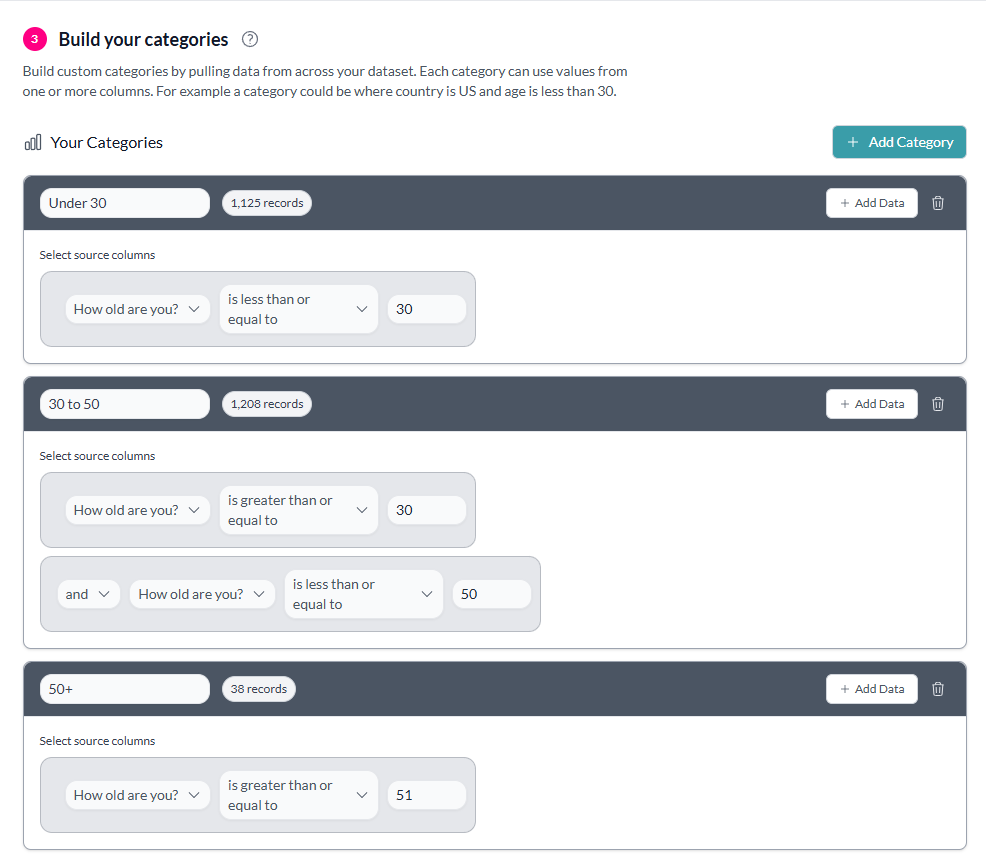
Add as many categories as you need by clicking Add Category.
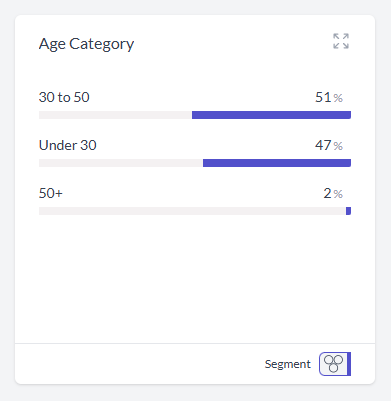
- Create the column — When you have finished, click Create Column. Your new custom variable appears at the top of your Chart Dashboard. You can now explore, run statistical calculations against it, and filter by it.
To use a custom variable for fixed numeric or date bins, see How to create custom bins.