Share Guess Charts
Create engaging, interactive charts that hide the results until viewers guess the answer. Perfect for presentations, training sessions, or making data exploration more fun.
What are Guess Charts?
Guess Charts let you share a chart with a built-in quiz. Viewers see a question with multiple choice options and must make their guess before the chart is revealed. This creates an interactive experience that encourages engagement and helps viewers think about the data before seeing the results.
Creating a Guess Chart
To create a Guess Chart:
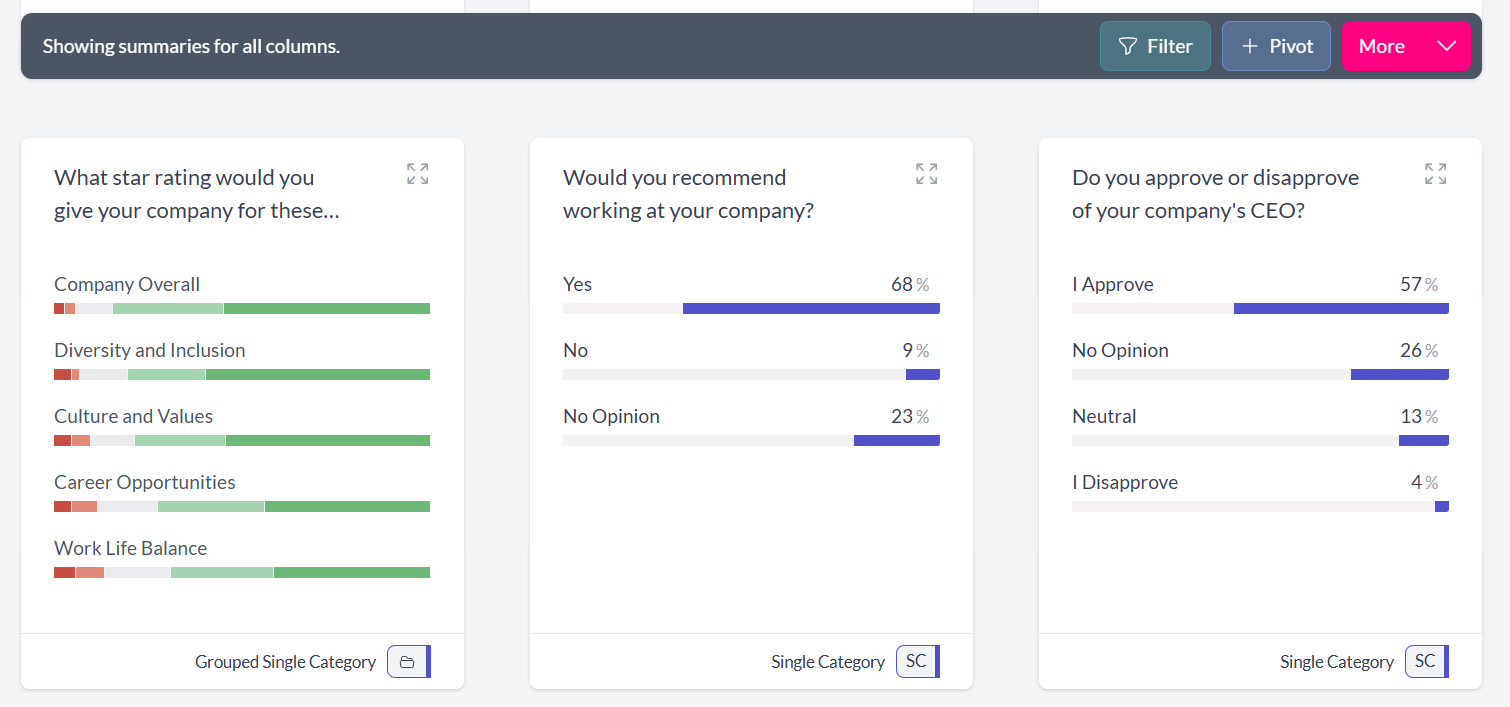
- Navigate to your chart — Open any chart you want to share
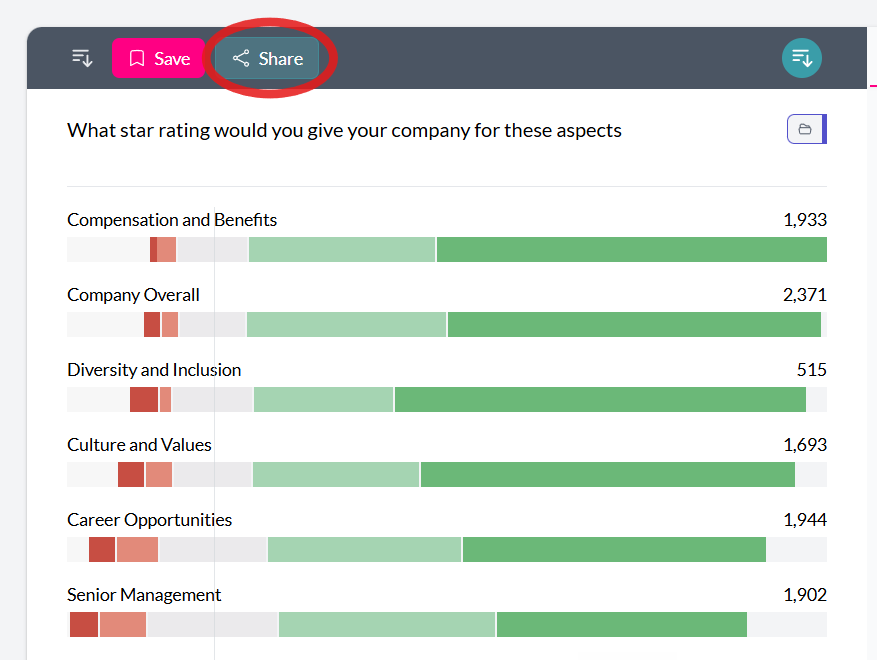
- Click the Share button — Look for the Share icon in the chart actions menu
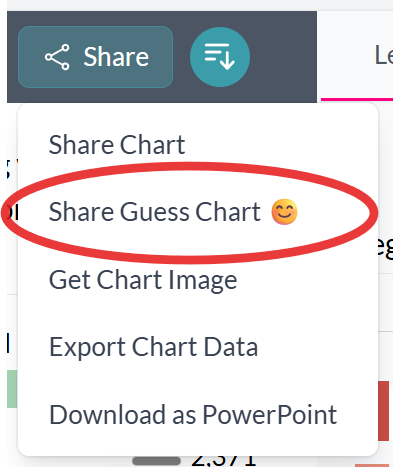
- Select "Share Guess Chart" — Choose this option from the Share dropdown menu
- Configure your quiz — Set up the question, options, and correct answer (see below)
Setting Up Your Quiz
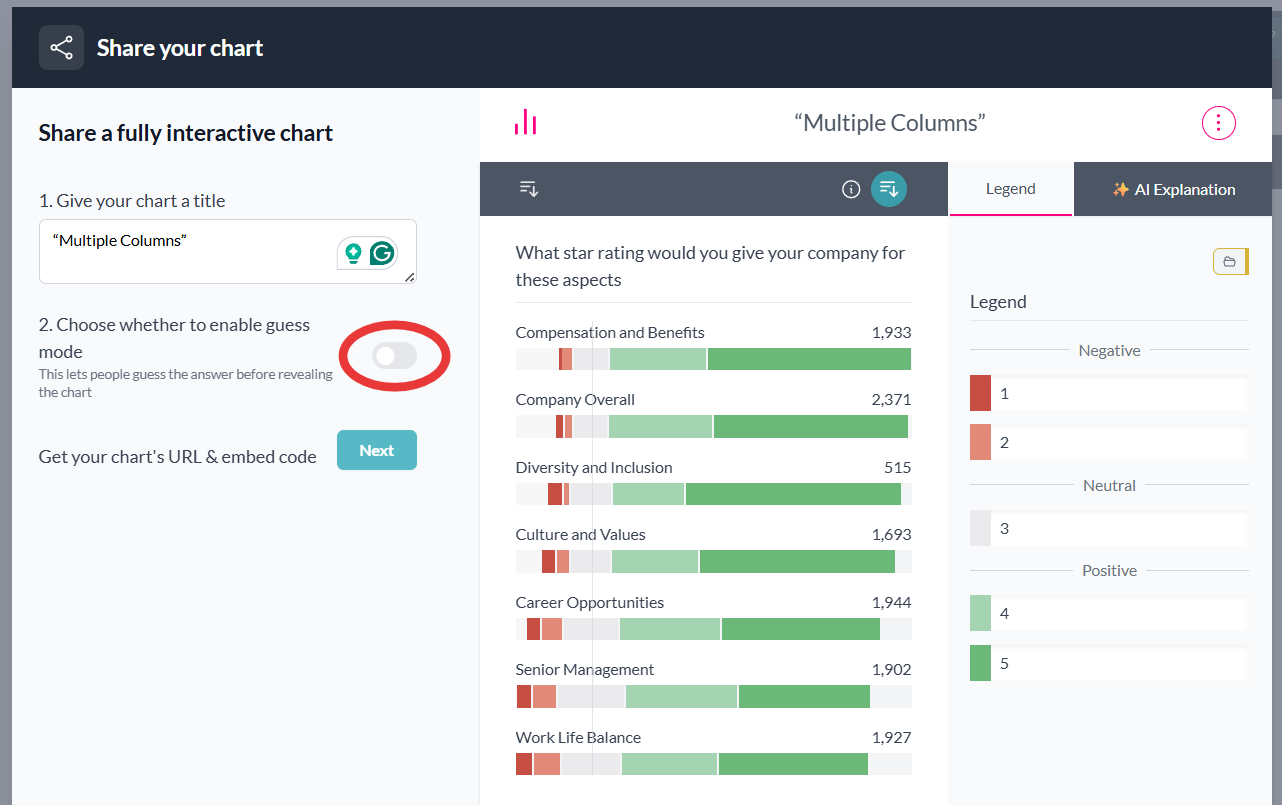
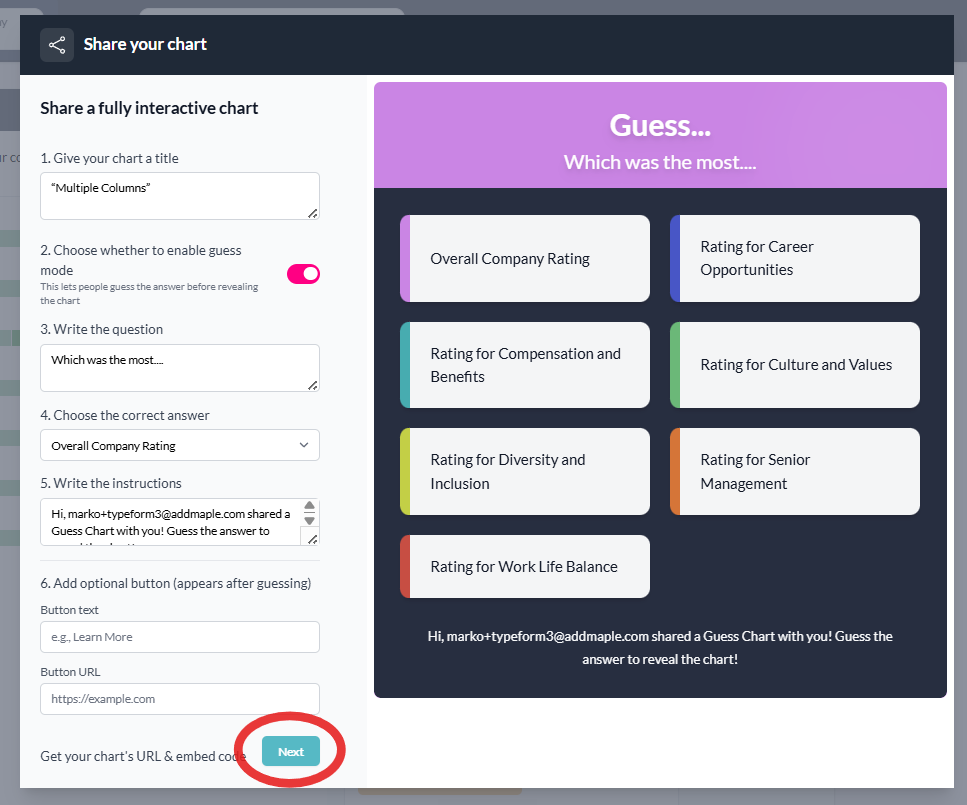
When you select "Share Guess Chart", AddMaple opens the sharing dialog where you can configure guess mode. You'll see several options to customize:
1. Give Your Chart a Title
Enter a descriptive title that will appear when the chart is shared. This helps viewers understand what they're looking at.
2. Enable Guess Mode
Toggle the "Enable guess mode" switch to activate the quiz functionality. This option only appears when your chart has multiple categories or options to choose from.
3. Write Your Question
Create a clear question that viewers will answer. For example:
- "Which category received the highest score?"
- "What was the most popular response?"
- "Which region had the largest increase?"
The question should relate directly to what your chart shows.
4. Choose the Correct Answer
Select the correct answer from the dropdown menu. AddMaple automatically populates this list with options from your chart data, making it easy to select the right answer.
5. Customize Instructions
Write instructions that will appear below the question. The default message explains that viewers should guess the answer to reveal the chart. You can customize this to match your style or add specific context.
How Viewers Experience Guess Charts
When someone opens your shared Guess Chart link:
- They see the question — The quiz question appears prominently at the top
- They view the options — Multiple choice options are displayed as clickable buttons
- They make their guess — Clicking an option reveals whether they were correct
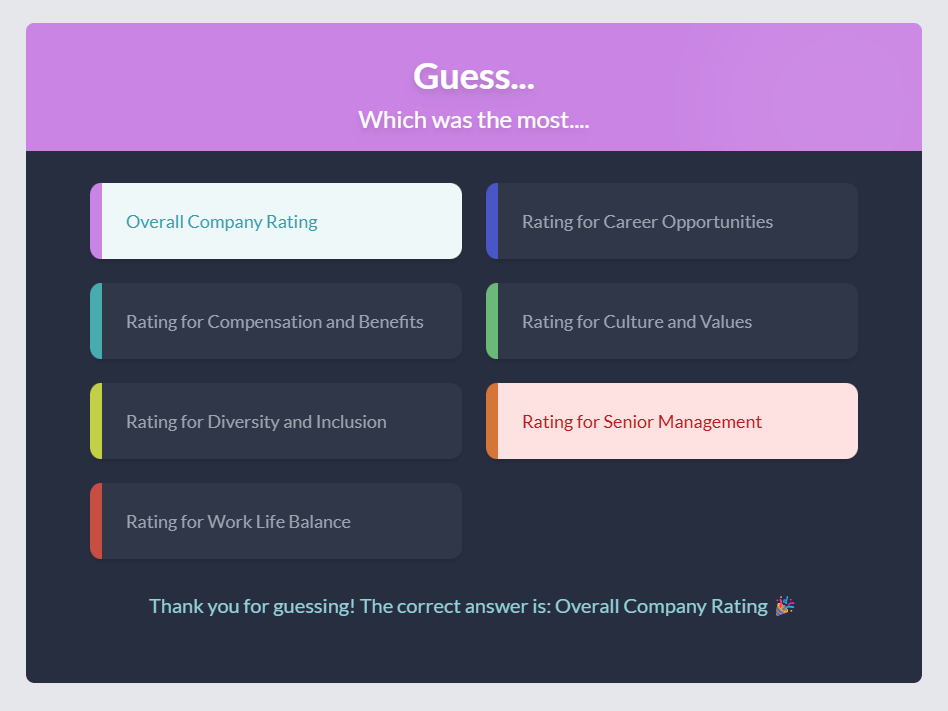
- The chart appears — After the result is shown, the full chart is revealed automatically
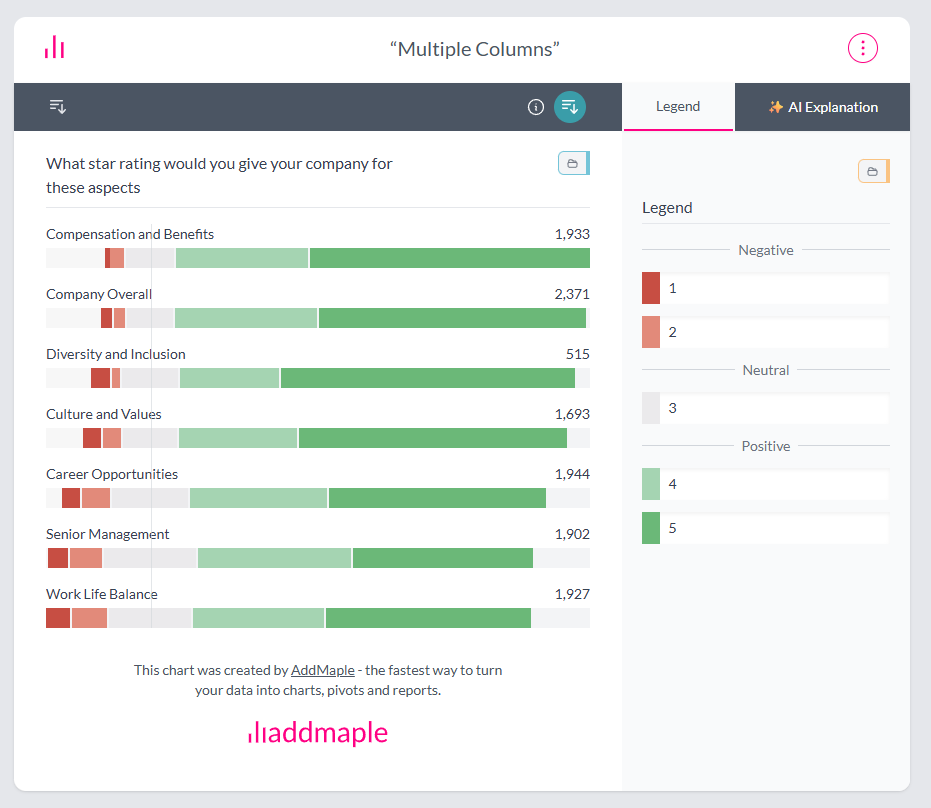
The experience is smooth and engaging, with visual feedback showing correct and incorrect answers before transitioning to the chart view.
When to Use Guess Charts
Guess Charts work great for:
- Presentations — Engage your audience before revealing key insights
- Training sessions — Help people think critically about data before seeing results
- Social sharing — Create interactive content that encourages clicks and engagement
- Educational content — Teach data literacy by having viewers predict outcomes
Technical Notes
- Guess Charts work with any chart that has multiple categories or options
- Options are automatically extracted from your chart data (up to 10 options)
- The chart remains hidden until the viewer makes a guess
- All shared charts respect your project's color settings and styling
- Guess Charts can be embedded in web pages just like regular shared charts