
How to work with legends
Legends control how categories are displayed in charts and pivot tables. They are the place to rename, reorder, merge, recolor, and otherwise manage how your data appears.
You can open the legend in two ways:
- In a pivot chart: click the Legend tab on the right-hand panel
- In Manage Column(s): open the column details view and switch to the Legend tab
Actions in the legend
You can do the following:
- Rename categories – Click a category name to edit it.
- Reorder categories – Drag to reorder, or click Reverse Order to flip the list.
- Hide or show categories – Click the hide icon next to a category to exclude it, or the show icon to bring it back.
- Merge categories – Select two or more categories (click one at a time or use Shift to select a range), then click Merge.
- Assign colors – Click a category's color swatch to assign:
- A completely custom color
- A color from your current preset
- The preset applied to all remaining categories for that column
- Ordered vs Independent – Toggle between:
- Ordered Categories (treat categories as ordinal, e.g. Likert scales)
- Independent Categories (treat categories as nominal, e.g. segments)
- Clean with AI – Automatically renames, orders, and optionally merges categories.
- Reset to original – Restore the legend to match the raw data.
Saving and persistence
- After making changes, click Save. The chart will update immediately.
- Changes are persisted for the column, not just for one chart.
- Example: if you assign custom colors to segment categories, those colors will appear consistently across all charts and exports whenever you pivot by that column.
1After editing anything in the legend, click save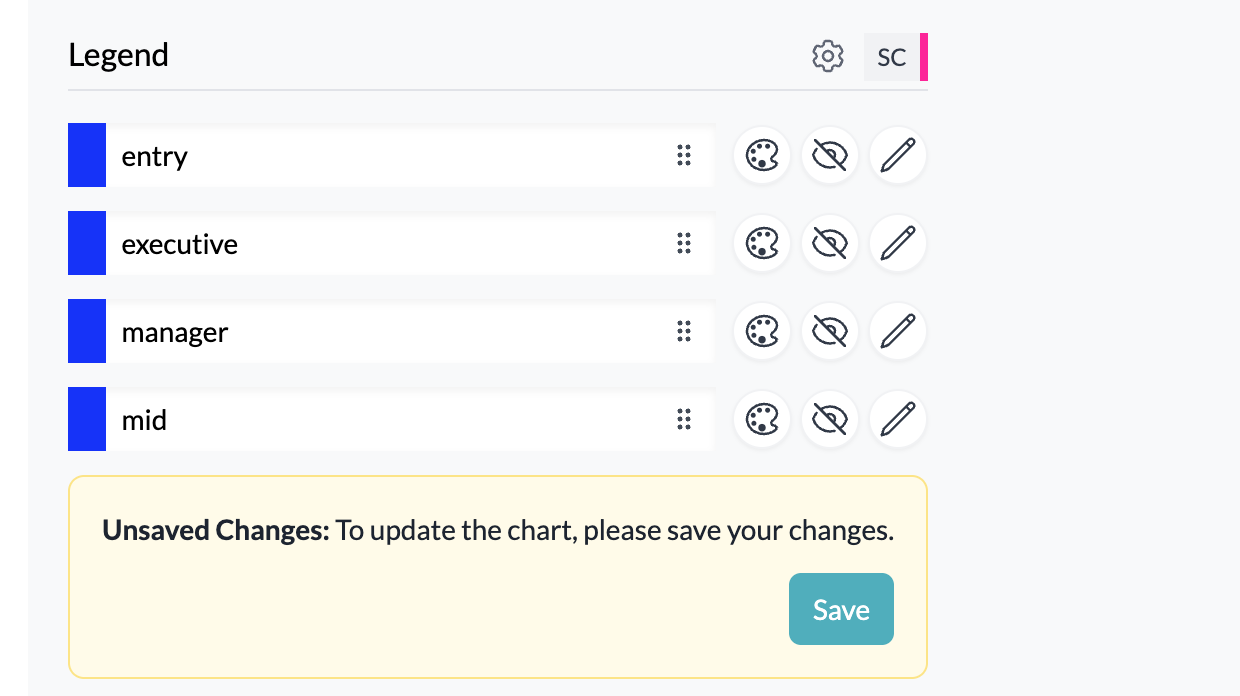
Viewing mappings
If you have renamed or merged categories, click View Mappings to see how the original categories from the raw data have been mapped to the new ones.
2Example of category mappings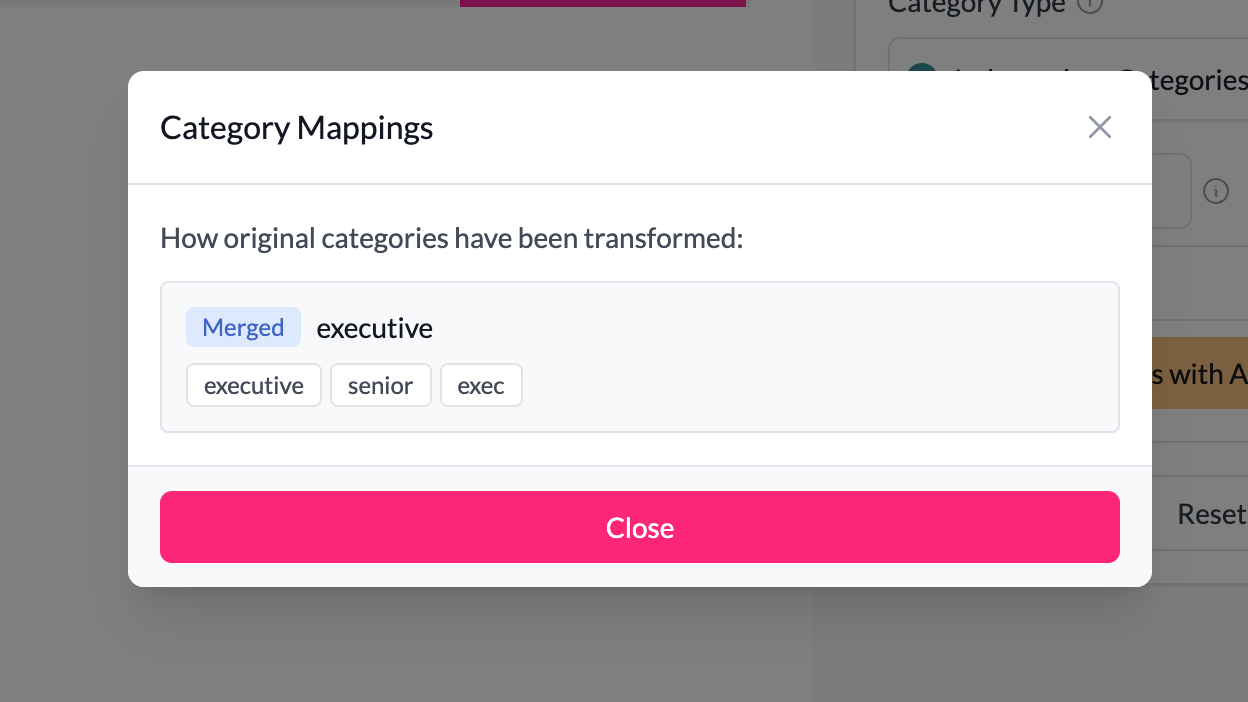
Limitations
- Numeric bins and date bins cannot be edited in the legend. For these, the legend is read-only.
- To change bins, use Custom binning.
Example
A survey export includes a text column for "Region" with inconsistent values: "U.S.," "USA," "United States."
- In the legend, select all three and click Merge.
- Rename the merged category "United States."
- Assign a custom blue color from your preset.
- Save your changes.
All charts and exports will now show a clean, consistent "United States" category.
Key points
- Legends are the central place to clean, reorder, and recolor categories.
- All changes persist across your project and carry into exports.
- Numeric and date bins cannot be adjusted from the legend.