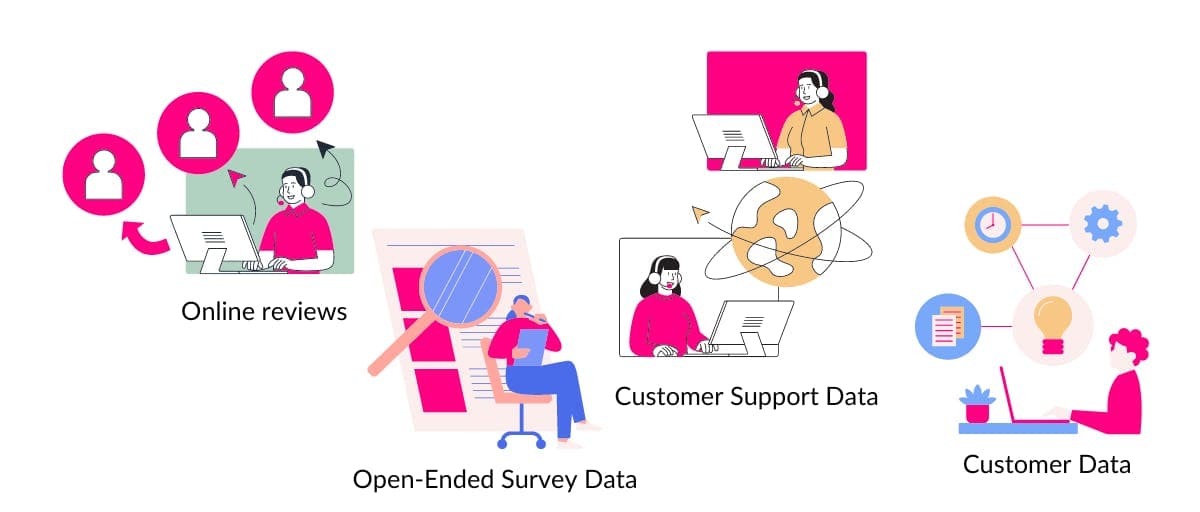
In today's data obsessed culture, significant resources are invested in the collection, security, and storage of data. From meticulously gathering customer feedback to ensuring the highest standards of data protection, organizations spare no cost in managing their data assets.
However, amidst this focus on data management, the analysis of free text—a gold mine of qualitative insights found in support tickets, sales calls, product reviews, and survey responses—frequently remains an afterthought. In 2023 the IDC (the International Data Corporation) published a white paper which found that 90% of the data generated by organizations was unstructured, and only 10% was structured. The vast majority of data processing and analysis budget goes towards structured data. According to IDC research, only half of an organization’s unstructured data is analyzed to extract value. If all data is to be considered as an asset — as echoed by many executives — then it must be treated as such.
This oversight means that a wealth of valuable insights remains untapped, hidden within the vast volumes of unstructured text that businesses accumulate over time. Organizations which learn to use automation and AI to synthesis these vats of insights will almost certain gain the advantage.
Text Analysis Augmented with Gen AI
Text analysis is augmented with Gen AI in AddMaple to bring clarity to complex unstructured data.
As cornerstones of qualitative research, Thematic and Categorical analysis provides structured methods for developing, analyzing and interpreting patterns across a qualitative dataset which involves systematic processes of coding/tagging to develop themes or categories.
Two Approaches: Thematic vs Categorical Analysis
AddMaple offers two approaches to text analysis using Gen AI
- Thematic Analysis uses codes to tag text data into specific units of meaning. Each code is distinct and differentiated, allowing consistent tagging of relevant text. These codes are then grouped to identify overarching themes and patterns within the text. These themes often reveal deeper meanings beyond the surface.
- Categorical Analysis uses codes to organize text data into clearly defined classes according to type. The codes are also distinct and differentiated to allow the text to be classified into buckets. Categorical analysis is more surface level - e.g. group this text by verbs, adjectives, subject mentioned, sentiment expressed. Categorical Analysis deals with the semantics of what was said.
Let's use Lego bricks to illustrate the difference between these approaches.
Imagine you have a basket of unsorted Lego bricks representing unstructured text data. The image below shows how you would sort, organize and analyze the Lego bricks using both approaches.
Left: The Lego bricks are arranged in a work of art for artistic expression to convey a message representing Thematic Analysis which reveals meaning in text data. Right: The lego bricks are arranged into compartments by color and type representing Categorical Analysis.

If we use a Thematic approach to sorting our Lego bricks, we would group these bricks into patterns or shapes in a quest for meaning until we are eventually able to interpret these into broader themes to tell a story or stories.
If we use a Categorical approach to sorting our Lego bricks approach, we organize them by type. We might even organize them multiple ways by different criteria, e.g. by color, by size, by year of release and combinations of those. AddMaple supports multi-way coding for multidimensional analysis of text data. This means you can code a text column for sentiment, subject/topic, feature requests etc. Each time you code data in AddMaple, a new column is created with your codes that you can use to segment the data. This is something we couldn't do with our Lego bricks because we would only be able to put one brick in one compartment. But digital data can be tagged/coded multiple ways.
Why Analyzing Unstructured Data Manually is Difficult
This brings us to why analyzing unstructured data manually is difficult. We usually only code data in one dimension if at all. Most organizations report not analyzing unstructured data at all. Let's dive into the common reasons and how Gen AI can help us overcome these.

1. Multi-Language Support
One of the foremost challenges in analyzing qualitative data as members of a global village is the diversity of languages your data might occur in, including a wide array of alphabet characters and scripts which many tools don't support.
Traditional text analysis methods often require separate coding staff and processes for each language and script, leading to increased complexity and the potential for inconsistency. This linguistic maze can significantly hinder the analysis of global surveys for example. When free text coding spans across people, tools and processes, it becomes challenging to maintain a coherent and unified analysis approach.
AddMaple solves this with the support of LLMs which are able to understand multiple languages at once and analyze such a rich body of multi language and multi script text data at once, using the same code book. This means the codebook contains universal codes with descriptions that LLMs use to consistently categorize text data across different languages, ensuring consistency. For example, a code for "customer complaints" would apply to relevant comments written in English, Spanish, Chinese, etc based on the same criteria defined in the codebook.
2. Missed Segmentation Opportunities
Let's look at free text responses in a survey as an example of missed segmentation opportunities. Oftentimes, this text data isn't analyzed at all but merely visualized in a word cloud. But let's say the verbatim data is coded and grouped into themes, these themes aren't usually brought back into the survey dataset to slice or segment the survey with for deeper learning. The reason for this is typically because free text responses are analyzed in a different tool than the data analysis tool used for the survey itself. Qualitative researchers might code the text data in a qualitative tool or in Excel using colors, but it is rare that the codes derived from the qual analysis are brought back into the survey dataset to segment or triangulate the survey data itself.
This siloed approach of qual analysis as a separate exercise from quant analysis restricts the depth of insights that can be gained, as it overlooks the potential correlations between textual responses and other data points within the survey. Not only can free text responses reveal insight about something we might not have known to ask in the first place, the insights uncovered as a result of the free text analysis might correlate with something else in the data, which would be overlooked unless the codes are used to segment or cross tabulate the data. In AddMaple you can code large amounts of free text responses in minutes, and then use our stats engine automatically reveal how the codes relate to other columns. You might realize that certain themes have a significant relationship with respondents job titles, something that would have been lost in traditional text analysis tools and approaches.
Example: UX Tools Survey Analysis
To illustrate what we mean, we have used the published dataset from UX Tools 2023 Design Tools survey and analyzed the final free text question, "Any final comments or feedback about the survey?"
- We use Gen AI to read the text and suggest suitable codes.
- We use Gen AI again to assign the codes row-by-row to each comment.
- Once the data is coded, we use AddMaple's stats engine to automatically reveal how columns are related.
- We see that Product Designers were significantly less likely to answer words to the effect of 'No Comment' to this question, likely indicating that they are the most invested in this survey compared to people working in other roles.

3. One-Dimensional Coding
Usually thematic or categorical coding of text looks at one focal point with which to code the data. Let's look at the same example of free text analysis we used in point 2 previously. The question read, "Please leave any feedback about the survey or final comments". The standard approach would be to code the responses according to feedback of the survey and the topics covered in the general comments. This is above board. But what if we could use another coding lens too?
For example the same question could be re-coded to look at sentiment with buckets ranging from very negative to very positive. This could then be used to cross tabulate the data with another column, e.g. let's look at the final comments by their role at work or their organization size.
Example: Multiple Coding Lenses
Below we look at one-lens with which we can code the open-ended survey question: "Any final comments or feedback about this survey?"

However, this example question is fairly broad as are the verbatim responses. We could also code it for emotion analysis, intent analysis, sentiment analysis, semantic analysis, depending on what we want to learn. By looking at these comments in a word cloud, we see the various approaches we could take.
AddMaple's word cloud is interactive, you can zoom in and out by filtering by one or two, three words etc. The word cloud shows us a variety of directions we could take. We could analyze this data according to descriptive patterns by looking at the adjectives used, such as interesting, helpful, long, fun, amazing, excited, love, feel, great appear. We also see industry related words such as tools, portfolio, process, appear which could lead us to code by UX design tasks. We also see specific UX Tools mentioned by brand such as Figma, Sketch, Userbrain, Protopie and more, which means we could also analyze by brands mentioned. We see industry related words mentioned such as designer, job, business, prototype - so we could look at this in context of the UX industry. We also see words that could express user intent such as move, add, coming, question, find, option.
- Word Cloud 1: Shows all meaningful words from the answers to the question. We are looking at single unit words, or unigrams. There were 680 responses to this question.
- Word Cloud 2: Shows all meaningful words for comments containing the word 'survey'. There were 86 comments containing the word 'survey'. We see all related words for those specific comments.
- Word Cloud 3: Shows all meaningful words for comments containing the words 'survey' AND 'great'. There were 14 comments containing those two words, or bigrams. We see all related words from those 14 comments too. Read more about AddMaple's text mining via interactive word clouds that give you adaptive cruise control in the form of unigrams, bigrams, trigrams here.

4. Rigid vs Flexible Coding Structures
Due to the time and effort it takes to code manually, a rigid coding structure is often preferred or specified in order to obtain repeatable and comparable results. This can make sense, where qualitative studies are repeated periodically.
However, this fixed approach (deductive) can be preferred simply due to the complex nature of coding unstructured data and often does not accommodate the dynamic and iterative process of developing a coding schema that truly reflects the nuance and complexity of the data at hand. Many surveys that started decades ago have codebooks that don't fully address the new issues of today as an example.
Researchers might be expected to fit their insights into pre-defined codes simply due to external constraints, rather than by what is best for the thematic or categorical analysis itself, which can stifle the discovery of new themes and categories and can limit the adaptability of the analysis to evolving research insights.
A tool that is flexible to work within an existing framework AND flexible to support the researcher who wishes to uncover new codes/meaning would offer the best of both worlds. With AddMaple, one can code using the existing codebook AND code again using a supplemented codebook with newly added codes. Because we use Gen AI, this won't be a drain on time and researchers could learn twice or thrice as much in less time than when coding manually.
5. Collaborative Validation
Best practices in thematic analysis and categorical analysis often recommend a collaborative approach, where multiple researchers review codes, themes, and concepts to ensure reliability, clarity and to reduce the risk of limited perspectives. But it is not always possible to work within a research pair or team. This scarcity of resources can lead to challenges in maintaining the quality and depth of analysis, as the collaborative review process is crucial for validating and enriching the thematic framework. In AddMaple, we augment the researcher by having the AI suggest codes, the human review/edit and add codes and we have the AI apply the codes iteratively together with the human researcher. In this way, we give researchers an AI research assistant, and with it, we are able to introduce additional perspectives/opinions at scale thanks to LLMs.
Side note: We refer to researchers' values, opinions, and experiences as perspectives, rather than simply labeling them as bias. Read more about this here
6. Counting Codes
In some instances counting the amount of times certain codes appear, isn't helpful, particularly when conducting thematic analysis. But in many cases a code count can be useful.
When is it not helpful to count codes? Some research projects search for meaning, regardless of the amount of times this idea or view was expressed. One interviewee might express an idea that is profound and sheds light to the topic being studied in such a way that it impacts the results profoundly even though those ideas were in the minority across research participants.
Here, all instances of distinct meaning are significant merely by virtue of being expressed. And this will be conveyed in the report, regardless of instances or count frequency. In qualitative analysis we recognize that numbers in of themselves, don't necessarily mean something is more true, more significant or more worthy of our attention.
When is it helpful to count codes? It is often helpful to quantify codes in order to gauge the urgency, prevalence or importance of items/tags/codes within text data. For example, in reviewing exit surveys and open ended answers where people type in their reasons for unsubscribing to a product, having a count of the number of times certain reasons were given, is useful. Without counting the codes, the impact of the analysis will be limited because it will be difficult to know which factors had the greatest bearing on a customer cancelling for a given period. This is why we simply count the amount of times codes occur within the qual dataset in AddMaple, but you can ignore these counts of course!
And as mentioned above, AddMaple also applies statistical significance testing to the text analysis codes to show our users when those codes relate to other columns. For example, let's say we're analyzing exit surveys for a webapp and one reason people gave for leaving was 'the app is slow'. AddMaple will automatically highlight how those codes relate to other columns and were there to be a connection with say, browser type, we will reveal that for you.
How AddMaple Solves These Challenges
And this brings us to AddMaple and specifically how we help you get structure from unstructured data.
By directly addressing the challenges above, AddMaple's text analysis tool not only offers solutions to the inherent limitations of traditional methods but also enhances the thematic and categorical analysis process, making it more accessible, flexible, efficient, and insightful for researchers dealing with complex, multi-lingual, and multi-dimensional data sets. We created our tool in collaboration with researchers and factored in the constraints they find themselves working within.
The AI-Researcher Collaboration Workflow
While AddMaple uses generative AI, this doesn't mean the AI will code the data a different way each time you open your project, nor does it mean that the researcher is left out of the coding process all together.
We've designed a dance of sorts, between researcher and AI assistant. A workflow that adapts according to the task at hand, the data being analyzed and is enjoyable, repeatable, accurate and intentional to let the researcher lead the process throughout!
Real-World Knowledge: Contextual Understanding
AddMaple uses the latest advancements in Generative AI and with it, the ability to apply real world knowledge to help researchers organize unstructured text.
Below is a screenshot of unstructured data from AfroBarometer's survey. AfroBarometer asked respondents living in Africa to write down the names of the countries with favorable economic models. Respondents listed countries in their own language. Gen AI with its contextual world knowledge understands that french speaking respondents from Cameroon and Senegal etc, use the name Allemagne for Germany. This would be time consuming for a researcher and would require them to have some knowledge of the African languages used by survey respondents. We put AddMaple's ability to categorize unstructured text to the test and asked it to sort the countries listed in the answers into continents.
Does AddMaple supports Open (Inductive) and Closed (Deductive) Coding?
Yes! When we developed this tool, we ensured that both Open (Inductive) and Closed (Deductive) coding approaches can work! Because both approaches are useful for different purposes. If we've lost you, skip to the sections below for details on what these approaches are, why each brings value and when to apply them.


The Inductive Approach: The data leads the exploration without preconceived codebooks or frameworks
The inductive approach analyzes qualitative data without preconceived ideas, codes, notions or theoretical frameworks. It allows researchers to immerse themselves in the data, allowing patterns, themes, and categories to emerge due to the researcher's engagement with the data, iteratively. Big Q TA goes beyond summarization of what was said, to meaning - this is more than summarization. As in, is not a passive approach where codes and themes jump out at the researcher but instead through reflexivity and time, deeper themes emerge that would not have been obvious.
This bottom-up approach is particularly useful in exploratory research where the aim is to uncover new insights or to study a new or less understood topic. It can capture complexities, contradictions, nuance and produces rich data. The disadvantage is that it is time consuming and requires the researcher to keep revisiting generated codes periodically. It also requires that codes be revisited whereby codes that are too similar be combined, and where duplicate codes within other themes be extracted and the themes themselves be reconsidered.
Use case for inductive thematic analysis: It could be used to study how people experience and use a brand new technology. Existing codes and frameworks won't exist yet. Without imposing any predefined categories, researchers can allow participants' own experiences to guide the identification of codes, and the patterns and themes that emerge. As new ideas come up, it may prompt the need for further data collection whereby the researchers have to conduct further interviews until they are satisfied that they understand enough. At the heart of the coding, theme development and interpretation of meaning, will be the active researcher, reflecting, considering and remaining open to understanding meaning within meaning. Without restraining results within a construct.

Conclusion
In conclusion, text analysis represents a critical, yet often underutilized, component of data management. The challenge of processing unstructured text—such as customer feedback, survey responses, and other free-text forms—is significant due to its volume and complexity. AddMaple addresses these challenges by employing generative AI to enhance both thematic and categorical text analysis. This approach facilitates deeper insights by enabling efficient coding and analysis across multiple dimensions and languages simultaneously, without the need for separate tools or coding teams for different languages.
AddMaple simplifies the text analysis process by allowing users to automatically code text data, integrate these codes within larger datasets, and perform multidimensional analyses quickly. This reduces the time and effort traditionally required for manual coding and allows for more dynamic and responsive analysis to emerging data trends.
By integrating AI, AddMaple not only streamlines the workflow but also ensures consistency and depth in the analysis of qualitative data. We encourage researchers and organizations dealing with large volumes of unstructured data to consider AddMaple as a tool to unlock the valuable insights lying dormant within their data, making the process more accessible and insightful.