Filter your data
How To AddMaple supports powerful instant filters that are applied across your entire dataset.
There are many ways of adding filters in AddMaple:
1. By clicking the "Filter" button
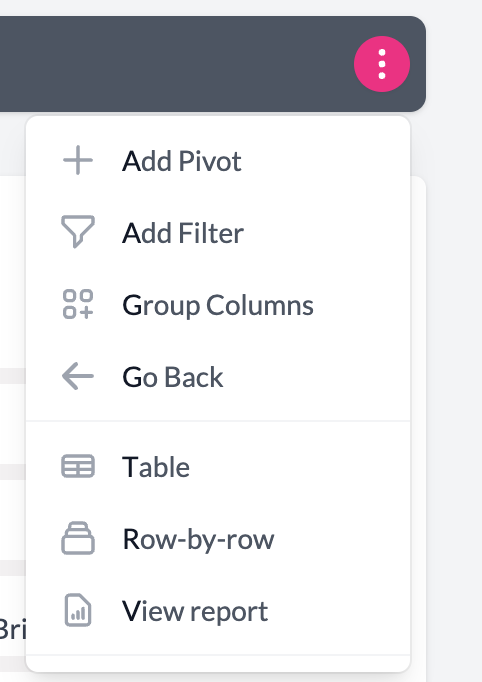
From the summary, chart, table or raw data views click the Filter button at the top of the screen (you can also press "/" on your keyboard to open the filter menu).

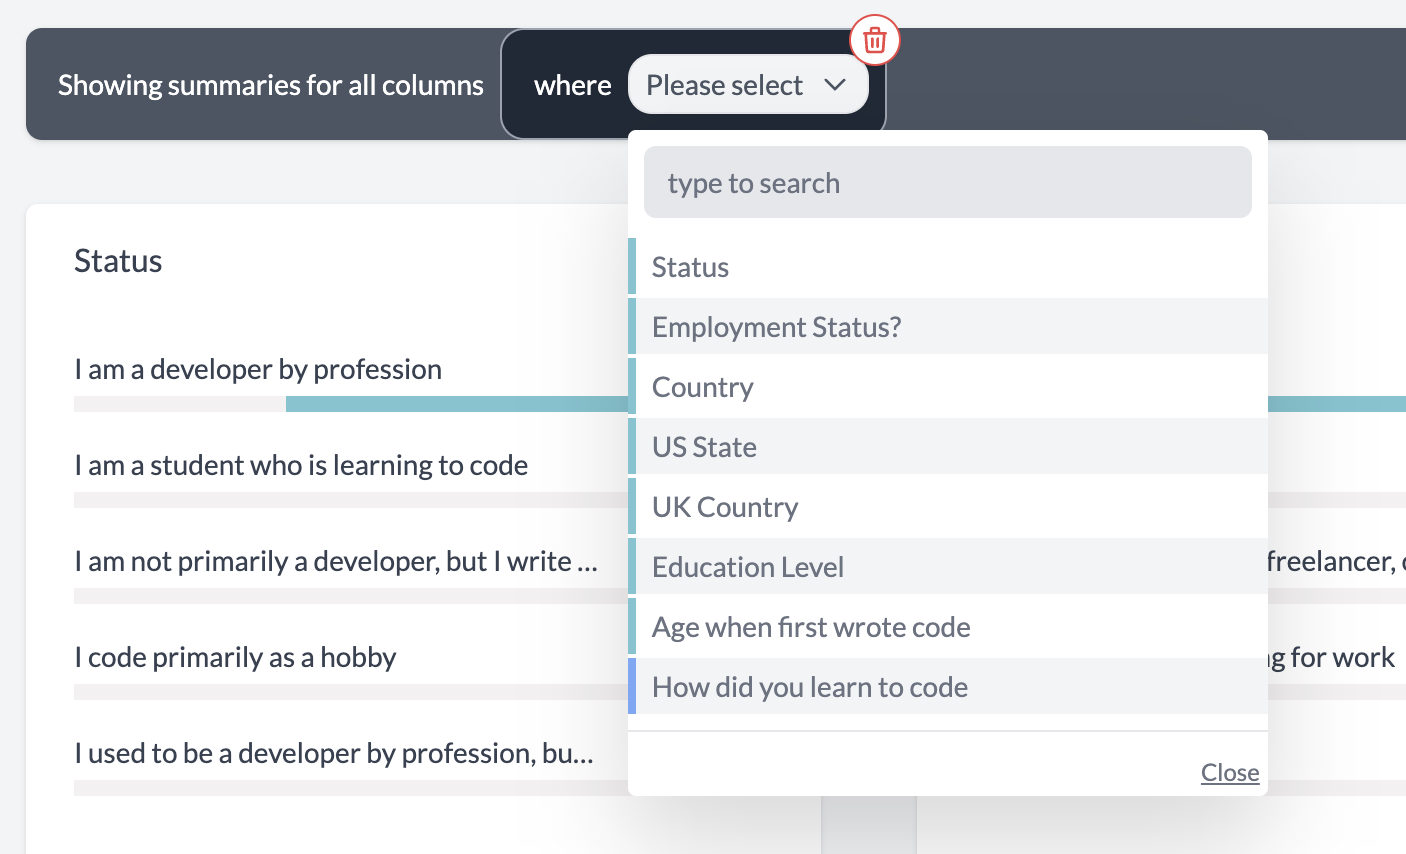
Click on the Filter button and a new menu will appear asking you to choose which column you would like to filter by

Note that the actual column names will be the names that AddMaple has detected from your data.
Choose a column (you can use your keyboard to help find a column quicker).
You will see that before each column name is an icon that shows the column type. For example in the above image most of the columns are "MC" - which means "multiple choice". Please see here for more info on the different column types that AddMaple detects.
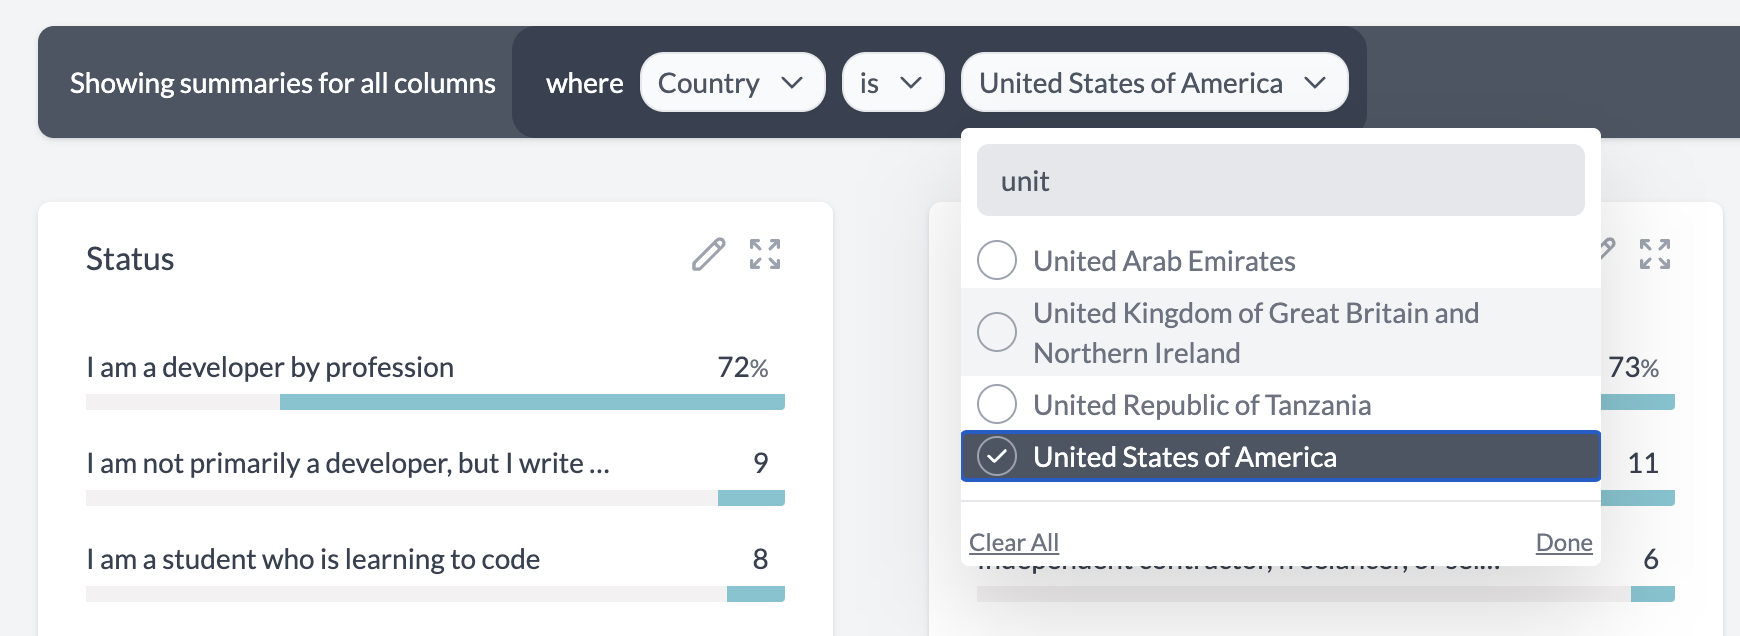
Once you have chosen a column you will be able to choose how to filter. The options you get depend on the column type. For example "MC" columns will let you filter for rows which match or don't match a certain value. Numeric columns allow you to search using "greater than", "less than" or "between".

Once you have chosen the value to filter by, AddMaple instantly filters the data.
2. From a chart
When you explore a particular column, you can filter by hovering over the chart:

In the above chart, hovering over the "Student, full-time" bar, brings up a small box that has a "Filter by this value" link.
Clicking on that link, will immediately add a filter for that value.
3. From a date chart
You can filter to a specific date range by clicking the relevant bar on a date chart:

4. From the table view
When you are in the table view, you can click on any of the MC+ or MC values in a row to automatically filter by them:

