How to use Weighting
Weighting allows you to adjust your survey results to better represent your target population. This is especially useful when certain groups are over- or under-represented in your sample, or when you need to match demographic distributions from census data.
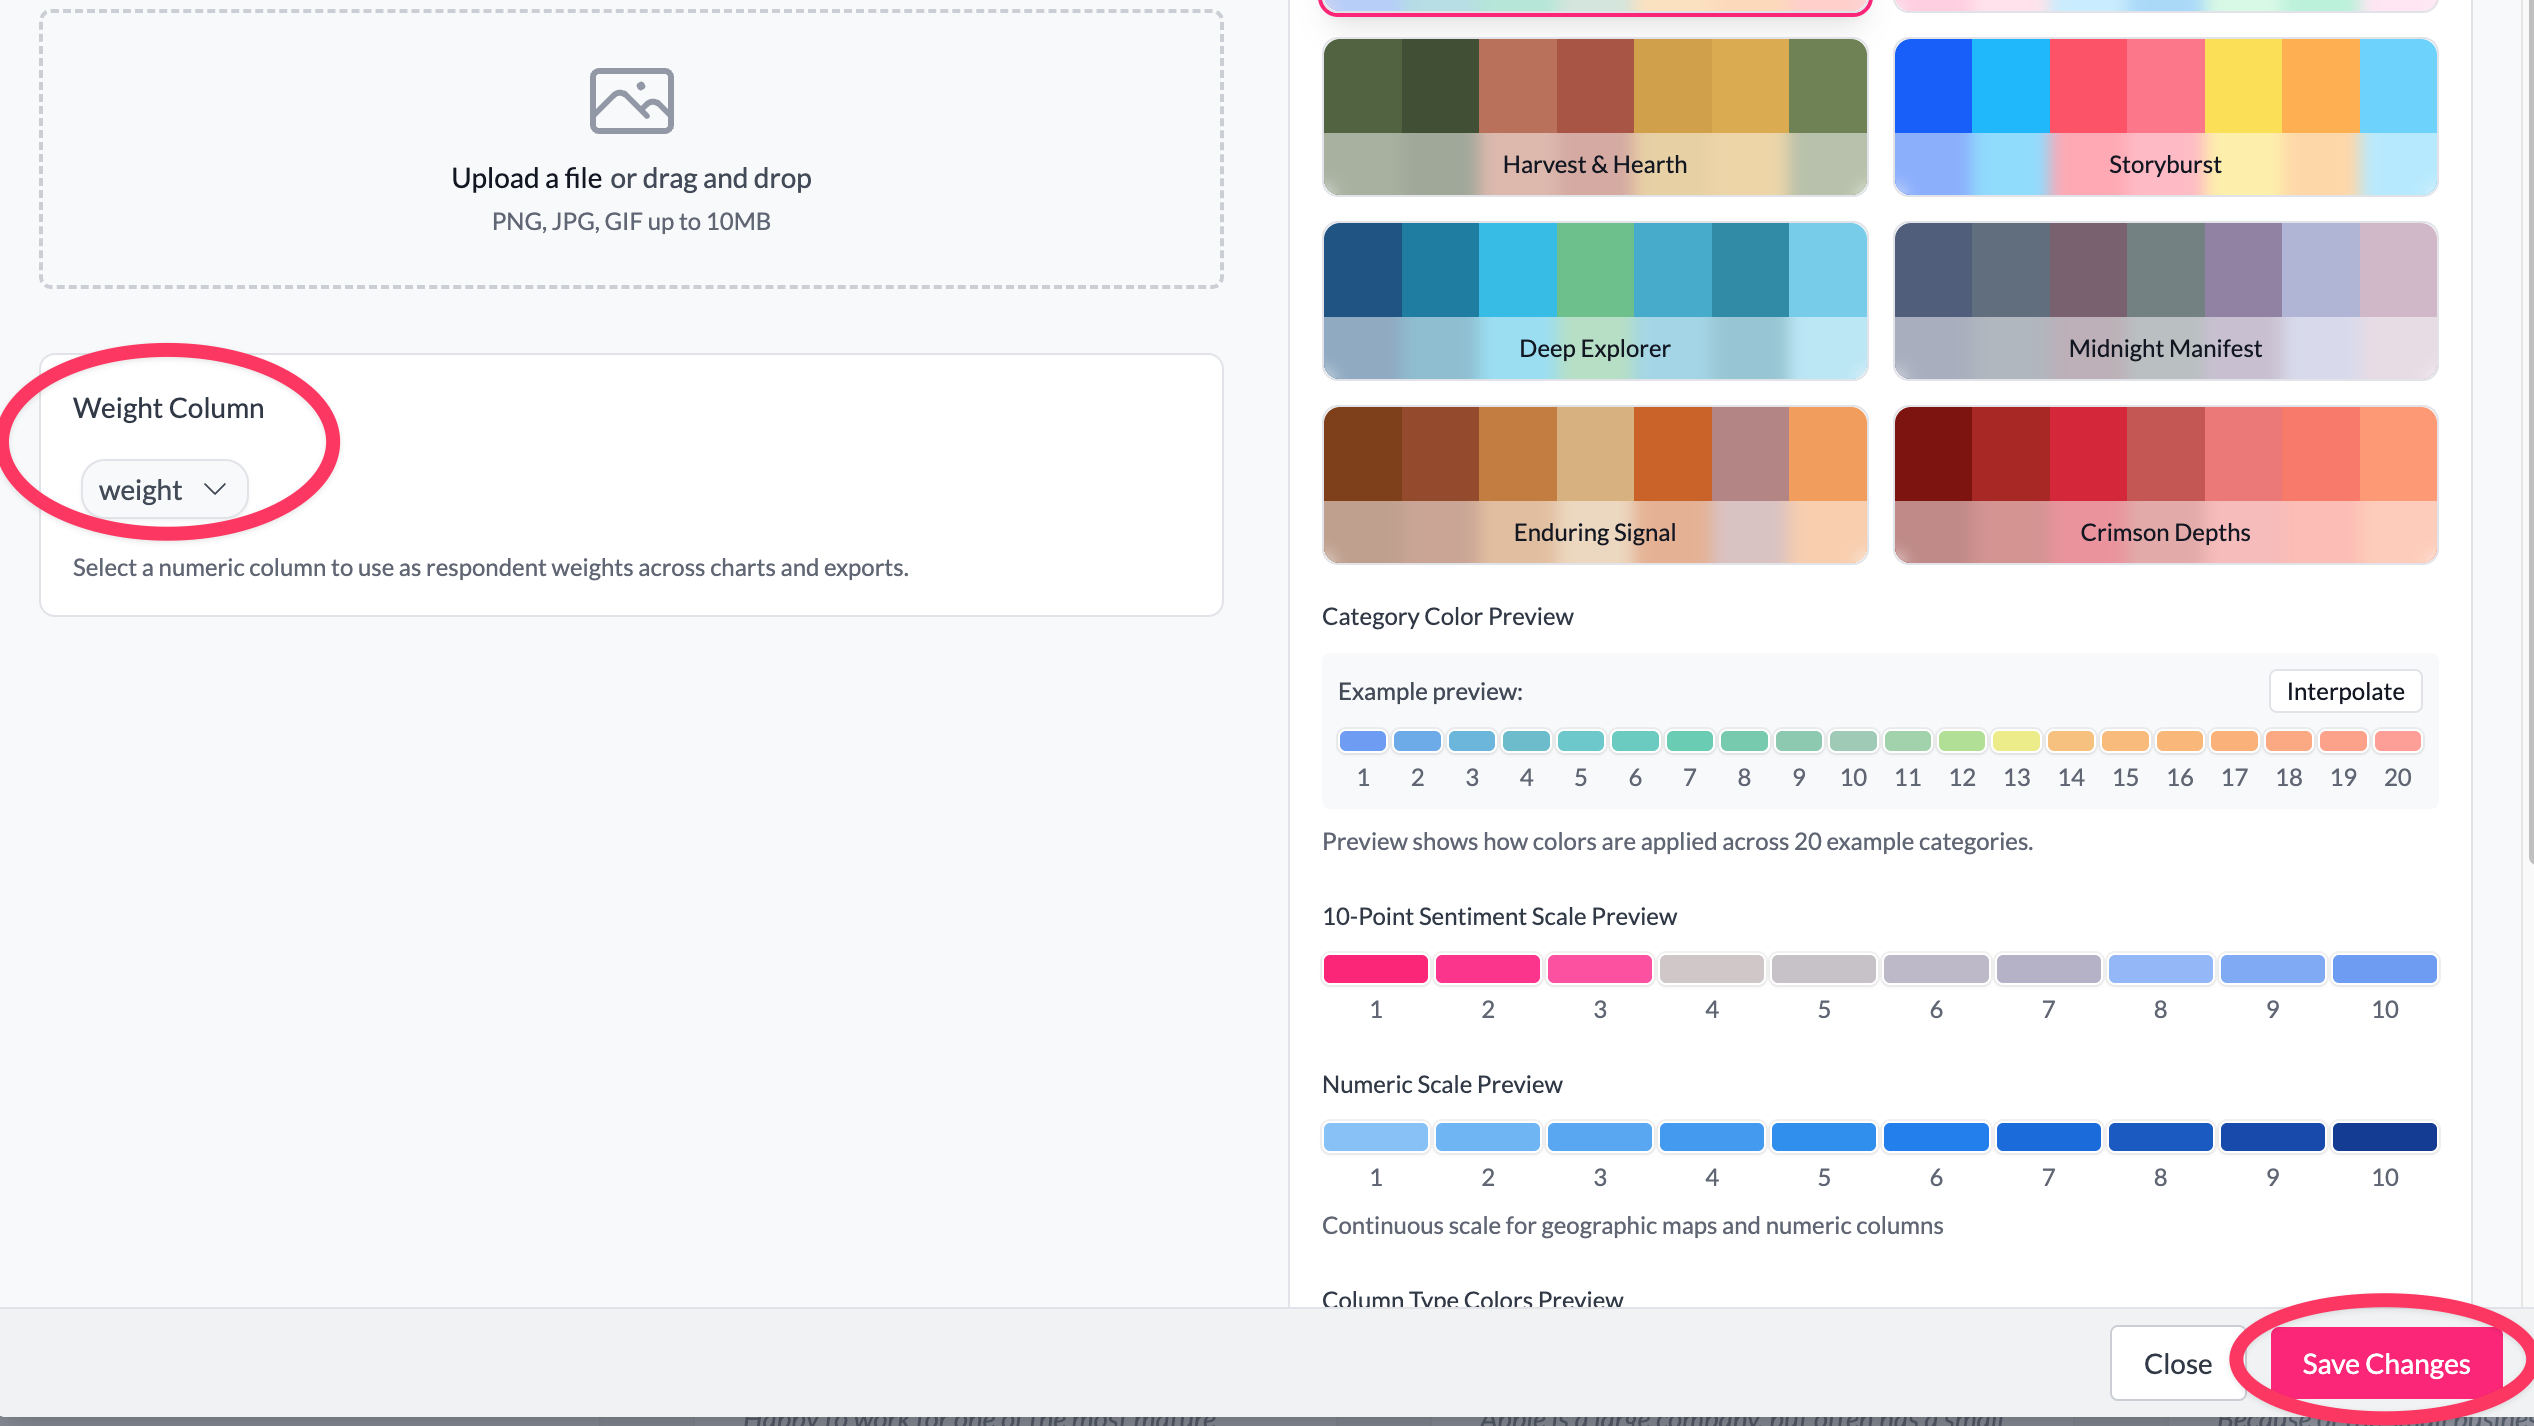
You can set your weight column in the Manage Project tab — the same place where you configure color presets. Go to More menu → Project Settings → Manage Project.

How weighting works
When you select a numeric column as your weight column, AddMaple applies those weights to all your analyses:
- Charts and pivot tables — All counts and percentages are calculated using weighted values
- Statistical tests — t-tests, chi-square tests, correlations, and ANOVA use weighted calculations
- Cross-tabulations — Every cell in your tables reflects the weighted sample
- Exports — PowerPoint presentations and data exports include weighted results
The weight column must contain numeric values greater than zero. Rows with missing, zero, or negative weights are treated as having a weight of 1.
Note: Currently, AddMaple doesn't calculate weights for you — you need to create your own weight column. However, automatic weight calculation will be available soon, making it easier to generate weights based on demographic targets.
Setting up weights
- Choose your weight column — Select a numeric column from the dropdown (only numeric columns are available)
- Save your changes — Click Save in the bottom right to apply weights across your project
Examples
1. Demographic weighting Suppose you surveyed 1,000 people but your sample has too many young respondents and not enough older ones. You can create a weight column where:
- 18-34 year olds get a weight of 0.8 (reducing their influence)
- 35-54 year olds get a weight of 1.0 (normal representation)
- 55+ year olds get a weight of 1.3 (increasing their influence)
2. Response rate adjustment If certain groups had lower response rates, you might weight them higher to compensate. For example:
- Online responses: weight of 1.0
- Phone responses: weight of 1.2 (they're harder to reach)
- In-person responses: weight of 1.1 (moderate difficulty)
3. Geographic weighting To match national demographics, you might weight respondents based on their region:
- Urban areas: weight of 0.9
- Suburban areas: weight of 1.1
- Rural areas: weight of 1.2
Statistical considerations
AddMaple uses sophisticated weighted statistical methods:
- Weighted t-tests — Uses Kish effective sample size and Welch-Satterthwaite degrees of freedom
- Weighted correlations — Calculates Pearson correlations using weighted means and variances
- Weighted chi-square tests — Applies weights to contingency table calculations
- Weighted ANOVA — Uses weighted group means and variances
These methods ensure your statistical tests account for the weighting scheme and provide accurate p-values.
Best practices
- Check your weights — Extreme weights (>5.0 or <0.2) can distort results
- Document your approach — Note why you're weighting and how weights were calculated
- Test sensitivity — Try different weighting schemes to see how results change
- Consider effective sample size — Heavy weighting reduces your effective sample size
Removing weights
To stop using weights, simply select "None" from the weight column dropdown and save. All analyses will return to unweighted calculations.
Key points
- Weights apply to all charts, tables, and statistical tests in your project
- Only numeric columns can be used as weight columns
- Weights must be positive numbers (missing or invalid values default to 1)
- Statistical tests use weighted methods to ensure accuracy