Add Maple

🎉 Sentiment lab! Out now, a playground for multi-model sentiment analysis, try for free 🎉

CSV Join Tool

Select multiple CSV files and we will intelligently join them into a single file for you.

Greenpeace InternationalStanford UniversityBerkeleyCornell UniversityHarvardUniversity of Texas at Austin

How It Works

This tool allows you to join multiple CSV files together. It will attempt to find the best columns to join on, but you can change the column it uses. Every row from your primary file will be included in the output (even if there is no match in the other files).

You can select which file is the primary file by clicking the "Make Primary" button. You can also add a formula to the column to use for the join.

For example if you have a column with a date in it, you can use the formula YEAR($value) to only use the year for the join. The output will be a CSV file with all the columns from all the files.

If there are multiple matches in the other files, it will create a new row for each match. (This is the standard behavior for a SQL join)

The tool also shows you 5 example values from the column you selected in each file (with the formula applied). It also shows the percentage of values that overlap between the primary file and the other files.

After joining, use AddMaple to analyze your data

CSV Join logo

Instant explorable chart dashboard

You can load your joined data directly into AddMaple and get automated cross-tabs, summarized charts, word clouds, histograms and more. Simply sign up, select your file and see the results instantly.

AI Powered Chart Interpretation, Text Summaries & Thematic Coding

AI Powered Data Exploration

Save hours with AI. Spend less time cleaning and preparing data and more time analyzing and gleaning insights. Get a visualized dashboard to kickstart your data exploration. Use AI to summarize and code free text data and to interpret graphs in everyday language.

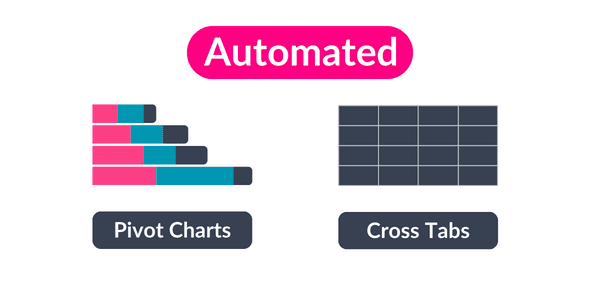
Automated pivot charts and cross tabs

Export or Share

Are you still manually pivoting data to summarize it? Turn each column into summarized tables and charts instead. Get calculated data tables for multiple columns in seconds that you can share as a table or a chart. 

Watch Our Short Explainer

Simply AddMaple To Your Data - Sweet!

AddMaple has reimagined data exploration using programming genius, the latest in-browser tech and of course AI to give you a data analysis tool that is truly modern and insanely fast.

We automate the data prep, formatting, cleaning and aggregation so that you can skip straight to insights.

Give AddMaple a raw dataset and it will turn your columns into summarized explorable charts instantly. From their you can segment, view cross-tabs, get column stats and more.

Visual-First, Code-Free Exploration

AddMaple's visual-first approach allows you to start analyzing data without the need to write complex code or formulas. With AddMaple, you can swiftly explore various columns and identify relationships in your data through interactive visualizations. Add pivots, segment or get AI-generated summaries.

Frequently Asked Questions

“

What people say