One tool to analyze quant and qual data for a complete customer picture
Understanding customers is harder despite more data—it’s fragmented across CRMs, surveys, reviews, and more. AddMaple turns raw quant and qual data into done-for-you dashboards with automated key driver analysis and text analysis in 80+ languages. Hear from Jeff Deighton (Insight Engineers) and Luisa Fortuna (Live Music Events) on cutting analysis time and making open-ended feedback seamless.
Show transcriptHide transcript
One tool to analyze quant and qual data
It is difficult to be data-led—less than half of Fortune 1,000 companies said they were last year. We have a lot of data but it is fragmented. If you look at the same customer, that data often lies in different platforms, making it difficult to get a holistic view of that customer's needs, their preferences, their motivations and their behaviors. We have CRM data, surveys, feedback forms, online reviews, transactional data, product analytics data—just to name a few. Despite having more tools and more data, it is now more complex to understand our customers and to produce what they are looking to buy.
In-house teams are proficient at their own data tools; they trust their own data. But when they try to paint a more complete data picture they're met with different systems that don't speak to each other, that export in different formats, require different tools to analyze, have different out-of-the-box reporting—and all of these often make it really difficult to answer important questions. It's no wonder that it's often easier simply to start research from scratch.
When we look at the agency side we see similar but different problems. The research cycle can take a lot longer than clients would like. When we've done the recruiting, the analysis, the slicing, the data processing, the reporting, the visualization of our research, we pass on our findings to clients who then often come back months later asking us to slice the data a different way. Not to mention that open-ended responses are often not even factored in. General-purpose AI chatbots are also not the solution if we want reliable, repeatable, accurate results.
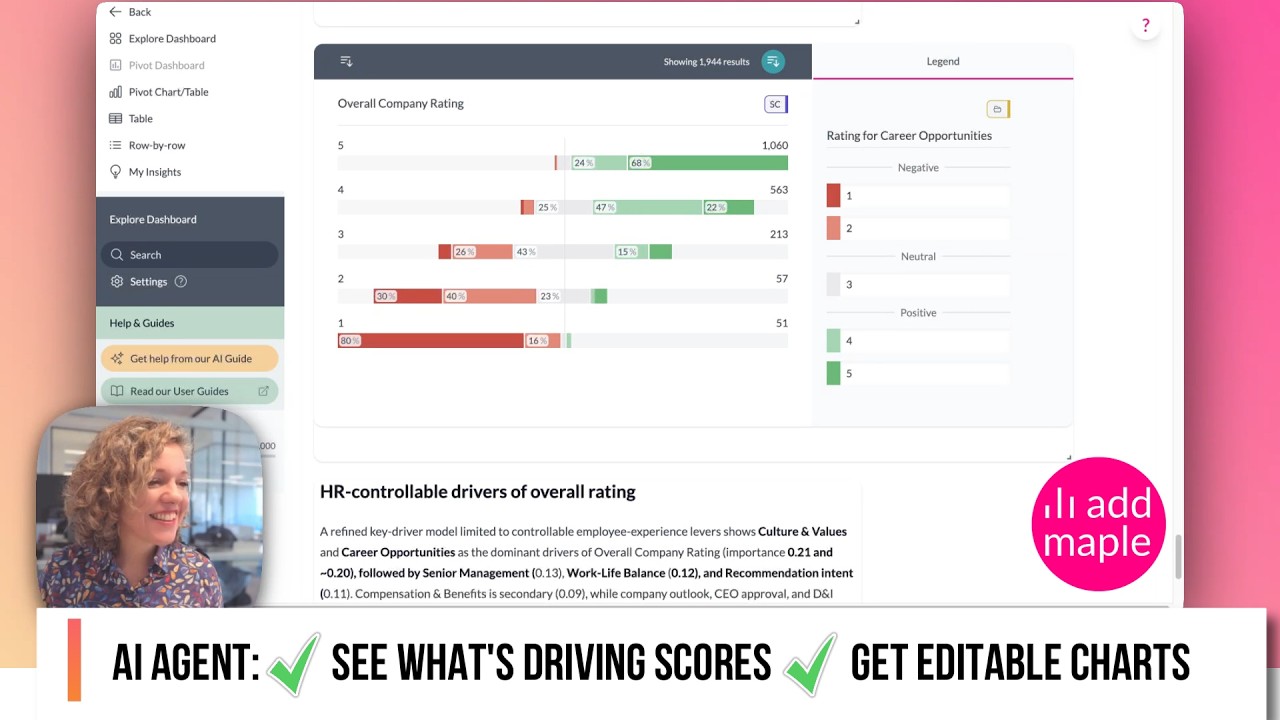
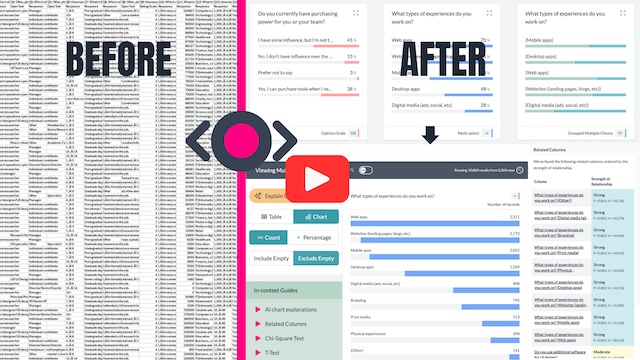
Introducing AddMaple. It is the only tool that turns your raw data into already-pivoted tables and ready-to-explore dashboards anyone in your team can dive into—complete with automated statistical testing to reveal patterns in your data for you. What about text? You can analyze it multiple ways, all in one tool. Let me show you.
Product manager: Pull your data in from almost anywhere, relabel or segment data as you need to, and now you can see which premium user segments are using your latest feature.
Restaurant owner: Pull your reviews in from online, analyze the text columns into themes, break a theme like "service" into its subparts, and use the AI prompt to pull out food excerpts from within the reviews—then analyze those excerpts for sentiment to see which foods were most loved.
Medical researcher: Dr. Tamy Yap used AddMaple to analyze 15,000 GP notes to see what brought oral cancer patients to see their doctor initially.
HR manager: Analyze employee reviews, use the stats engine to see how your company compares with your peers.
Data exploration just got super user-friendly and super human. Thanks to the researchers who have worked with us, giving us feedback and who have helped us develop AddMaple—AddMaple won Paddle's AI Launchpad competition out of 77 startups in 2025.
I built AddMaple because I was blocked by slow analysis processes working as a researcher in various industries. We released much-needed features that did not exist in the marketplace thanks to our research and training with over 500 people.
Column-level encryption allows you to encrypt sensitive columns whilst analyzing the rest of the data set. Column-level AI means that when you're analyzing text data, only that single column is visible to the AI via the API—which means you never have to upload the entire file. And the ability for you to see how the AI interprets your prompt while you're working so that you can refine it and stay in control.
Our pricing: We have three transparent plans. In AddMaple you get multiple tools in one, dashboards that you can share within your organization or your industry. You can pull data in from online to better understand the online narrative, automated statistical testing and advanced text analysis.
Jeff Deighton, Insight Engineers: Hi, I'm Jeff Deighton from Insight Engineers, a specialist boutique consultancy for qual and quant research the last 22 years. I wanted to give a reference for AddMaple and how it's contributed to getting more value out of the work that we do.
We've put three international qualitative jobs—about 45 to 50 interviews each—through AddMaple, and three quantitative studies: two of 500 and a tracker, and one of around 1,800 across three countries. The first thing is that the structure is very easy to understand and it goes up instantly. You can see immediately within a few seconds everything that you've had in the data structure.
On the 500-interview tracker we normally just selected verbatims out of that for a published report that's in the public domain for a major accountancy firm. We now code that. When I did it manually the first time it took me six hours. When I do it with AddMaple, including recoding—which is fantastic—I am able to do that in around two hours. So I'm at about a third of the time, and I'm finding it very accurate compared to six or seven other platforms that I've used over the last three or four years. Also no price per verbatim that's coded.
I'm just finding it really helpful that I can then copy that into a report which is interactive. The recoding function is really good. The export function is really good because I usually want to put it back into Excel. The other thing I like is the correlations—I'm able to look and see: does somebody who said a positive thematic code like "growth"—did they tell us that their outlooks for next year were very positive in terms of their growth as a business, their growth of profitability? So I've found a lot of coherence; it's much more easy to evidence to an end client.
On the call we quite often have two or three appendices in with rankings—what's important to you now, in the future, rank these items—and I've just found that I'm able to handle that data from my call in a grouped opinion scale very easily, understand how to combine those. And [AddMaple] has followed some things I've asked before—to move from a decimal to an integer, to be based on total sample not responses. I've got the ability to flip to and fro interactively and that's just really good. I haven't found that in any of the other six or seven platforms I've tried over the last three or four years.
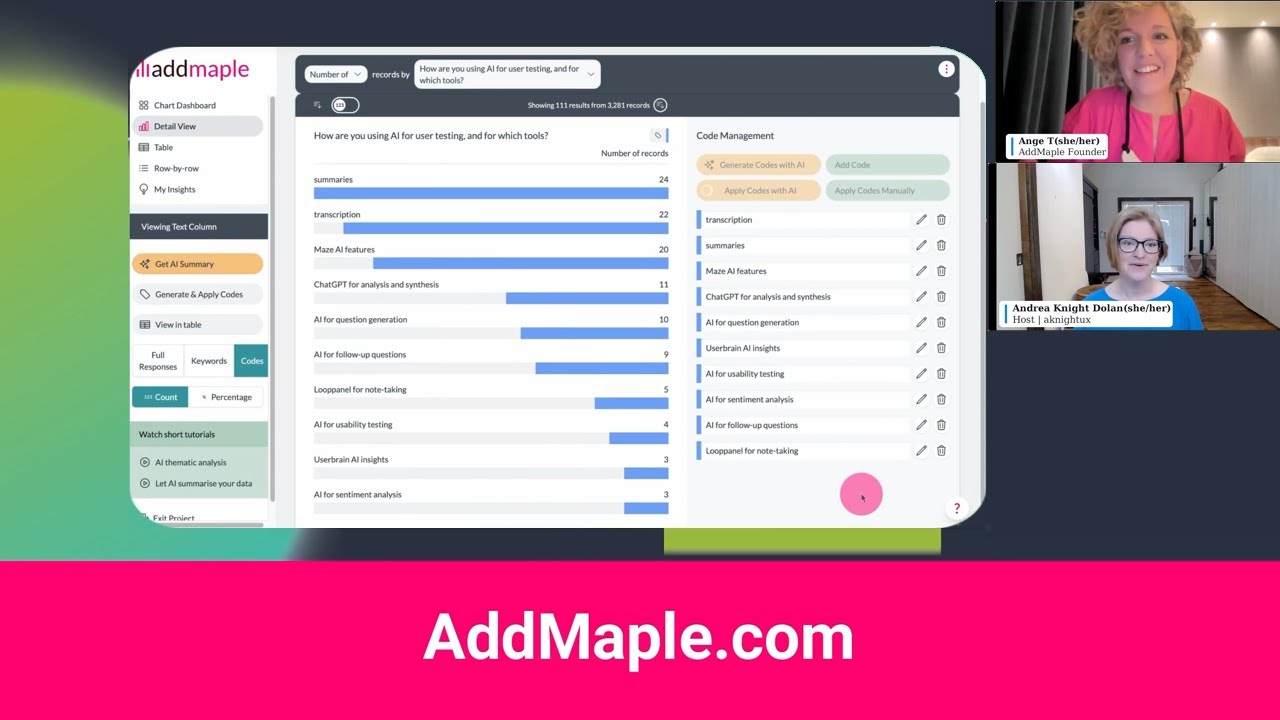
The AI summary on subgroups—I can look at something in an interactive word cloud, say right that's my biggest word count, drill down how about that with this other keyword, and then look at that through a certain type of job role and have an instant AI summary that I can read for coherence. Does it fit what we heard when we did the interviews? Six projects in less than two months. I'm really delighted with AddMaple's contribution to what we're doing—post analysis and creating the code frames to go into our finished Excel tables for quant studies. Thank you so much.
Luisa Fortuna, Live Music Events: I'm Luisa. I'm an insights professional. I've been in the industry for around 10 years. The company that I work for organizes big music events all around Europe. I would say two years ago every single show was doing their own thing. That's fine when you have 5 or 10 [shows], but when you have 60, 70 events it becomes really complicated because you're always having to sit back and think, okay I'm talking about this show and this is the kind of stuff that they want to know. That was a challenge.
Because we are an international company, when you get those results they are in different languages. The structure looks different. Sometimes you get a CSV file, sometimes you get an SPSS file and it's really hard to wrap your head around. I used to spend a lot of time translating things or just translating the headers of the responses to understand what I was talking about. And it was really difficult to analyze open-ended [questions] because you would have to think, how do I say "cues" in Dutch, how do I say "toilets" in Dutch, and then try to find those keywords in there. Even when I started looking into ChatGPT and things like that there used to be that limitation of text—so when you have 5,000, 10,000 responses, having to copy-paste different strings of text gets really long as well.
Now with AddMaple this is what's been really helpful. I can just go on the tool and I treat it as a co-pilot. I'm like, okay what are the top 10 things that we need to improve for this specific show? And it doesn't matter the language—it will always find these topics. Then I can also validate some things manually if I want, but the bulk of this heavy lifting is done by AddMaple, which is super time-saving for me.
In the beginning I was a bit skeptical and I tried manually coding open-ended [responses] of smaller surveys and see how the importance of those topics would compare to AddMaple's. I'm not going to say that it was a percentage-by-percentage match but the trend was very similar. And sometimes it would even highlight things that, because I'm not a native speaker of those languages, I would miss or I would misinterpret. So not only does it help me with the speed but it also for sure avoids me making assumptions and mistakes on especially the open-ended [questions].
Why not try AddMaple on your data?