Instantly Analyze Typeform Surveys with AI-Powered Insights
From raw responses to actionable insights in seconds
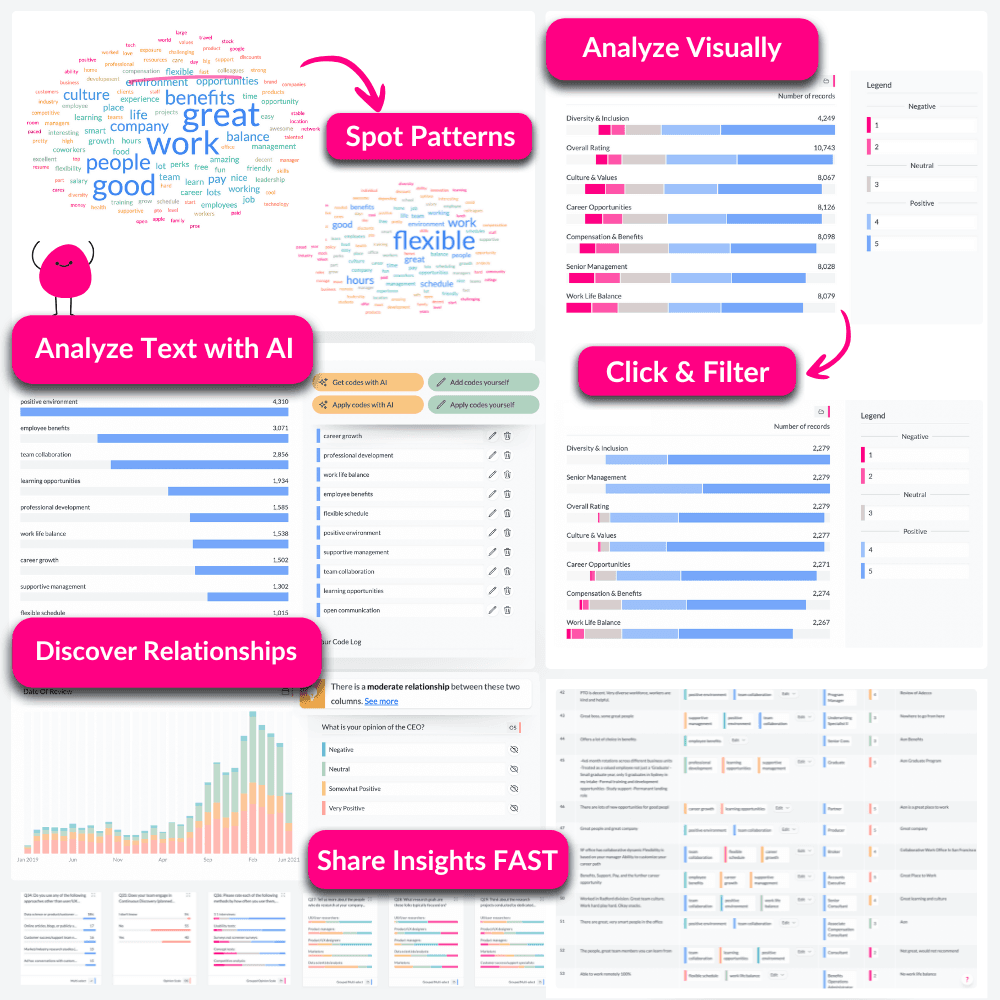
- ★Instant visual summaries of all questions
- ★AI-powered text analysis
- ★Advanced statistical insights
Watch how to use AddMaple with your Typeform data
★ Perfect for Beginners and Pros
★ No cloud uploads
★ Transparent Pricing
Get deeper insights from your Typeform data
Getting meaningful insights from Typeform responses often requires multiple tools and manual work, leaving valuable insights buried in spreadsheets.
Complex Data Processing:
Limited Analysis Options:
Time-Consuming Workflows:
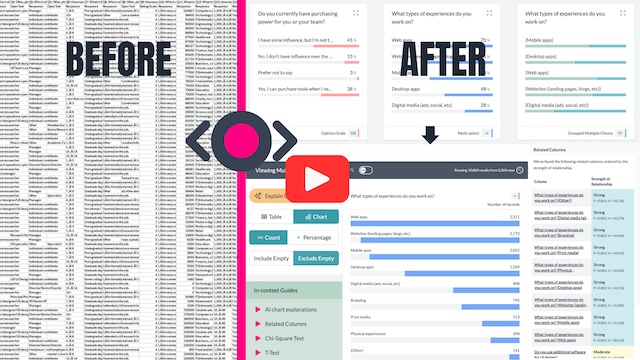
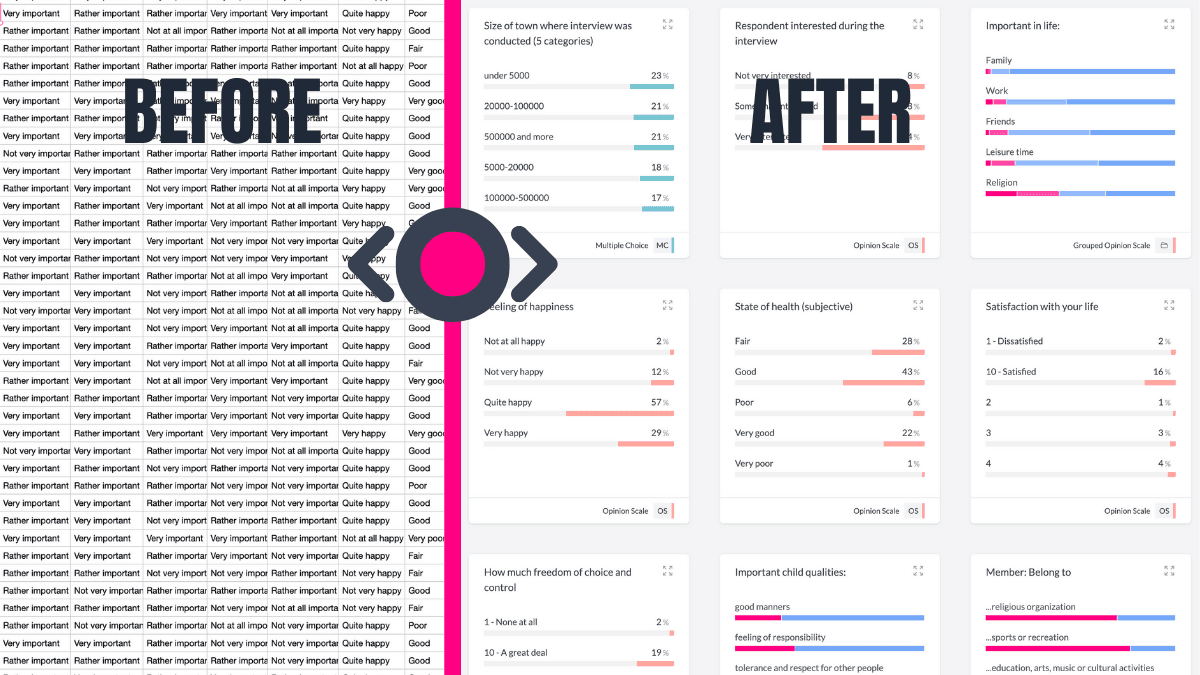
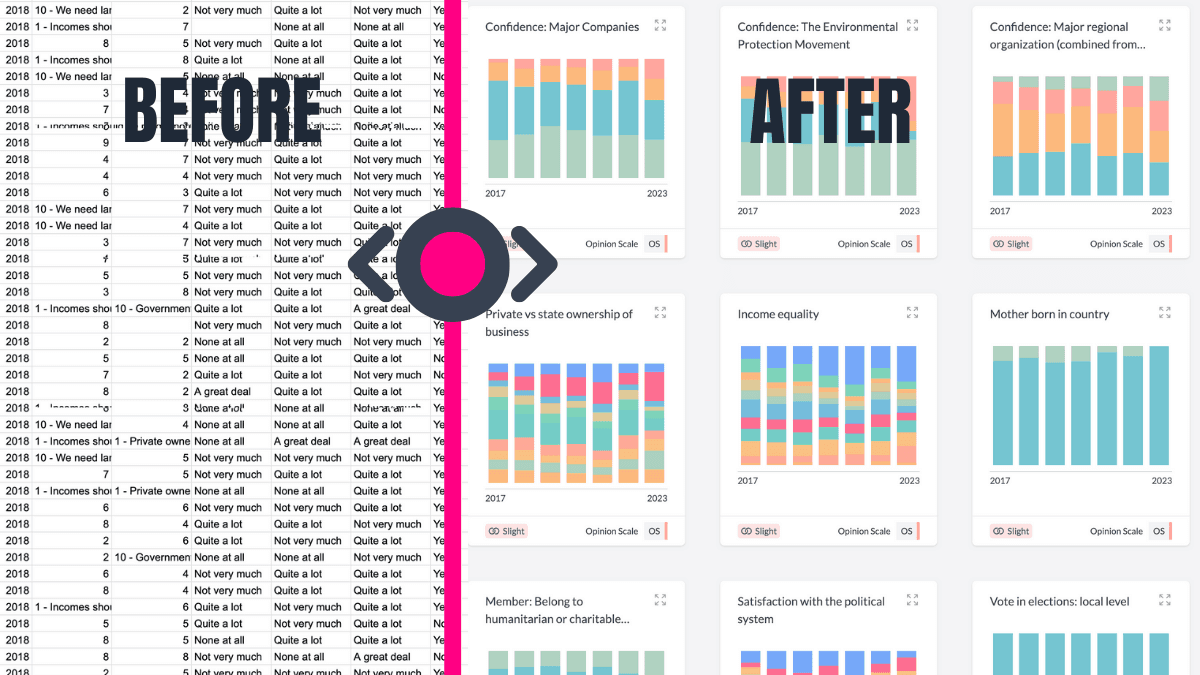
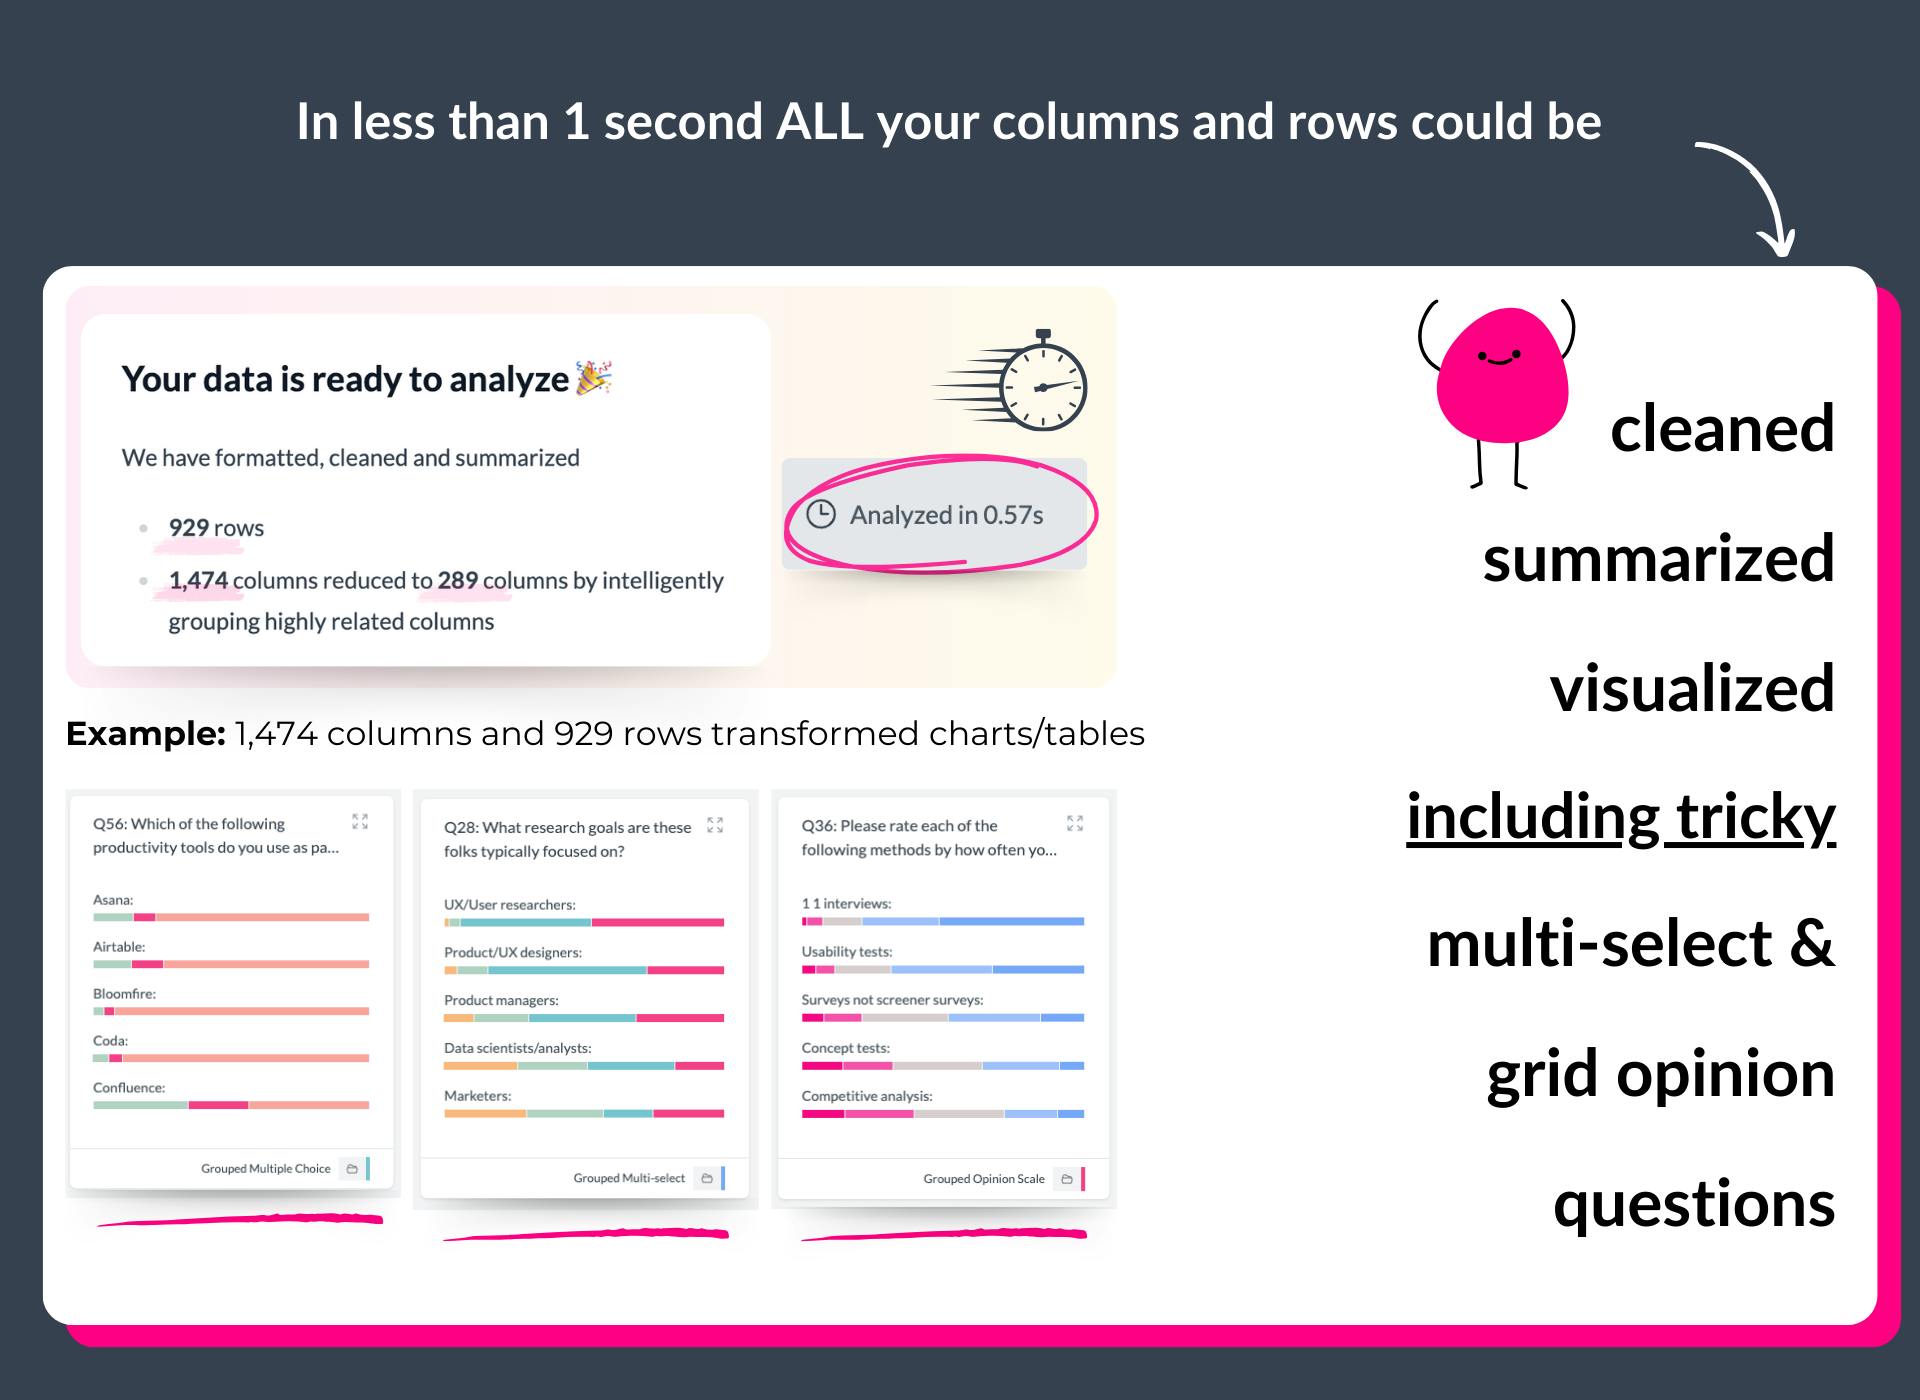
Start with Answers, Not Raw Data
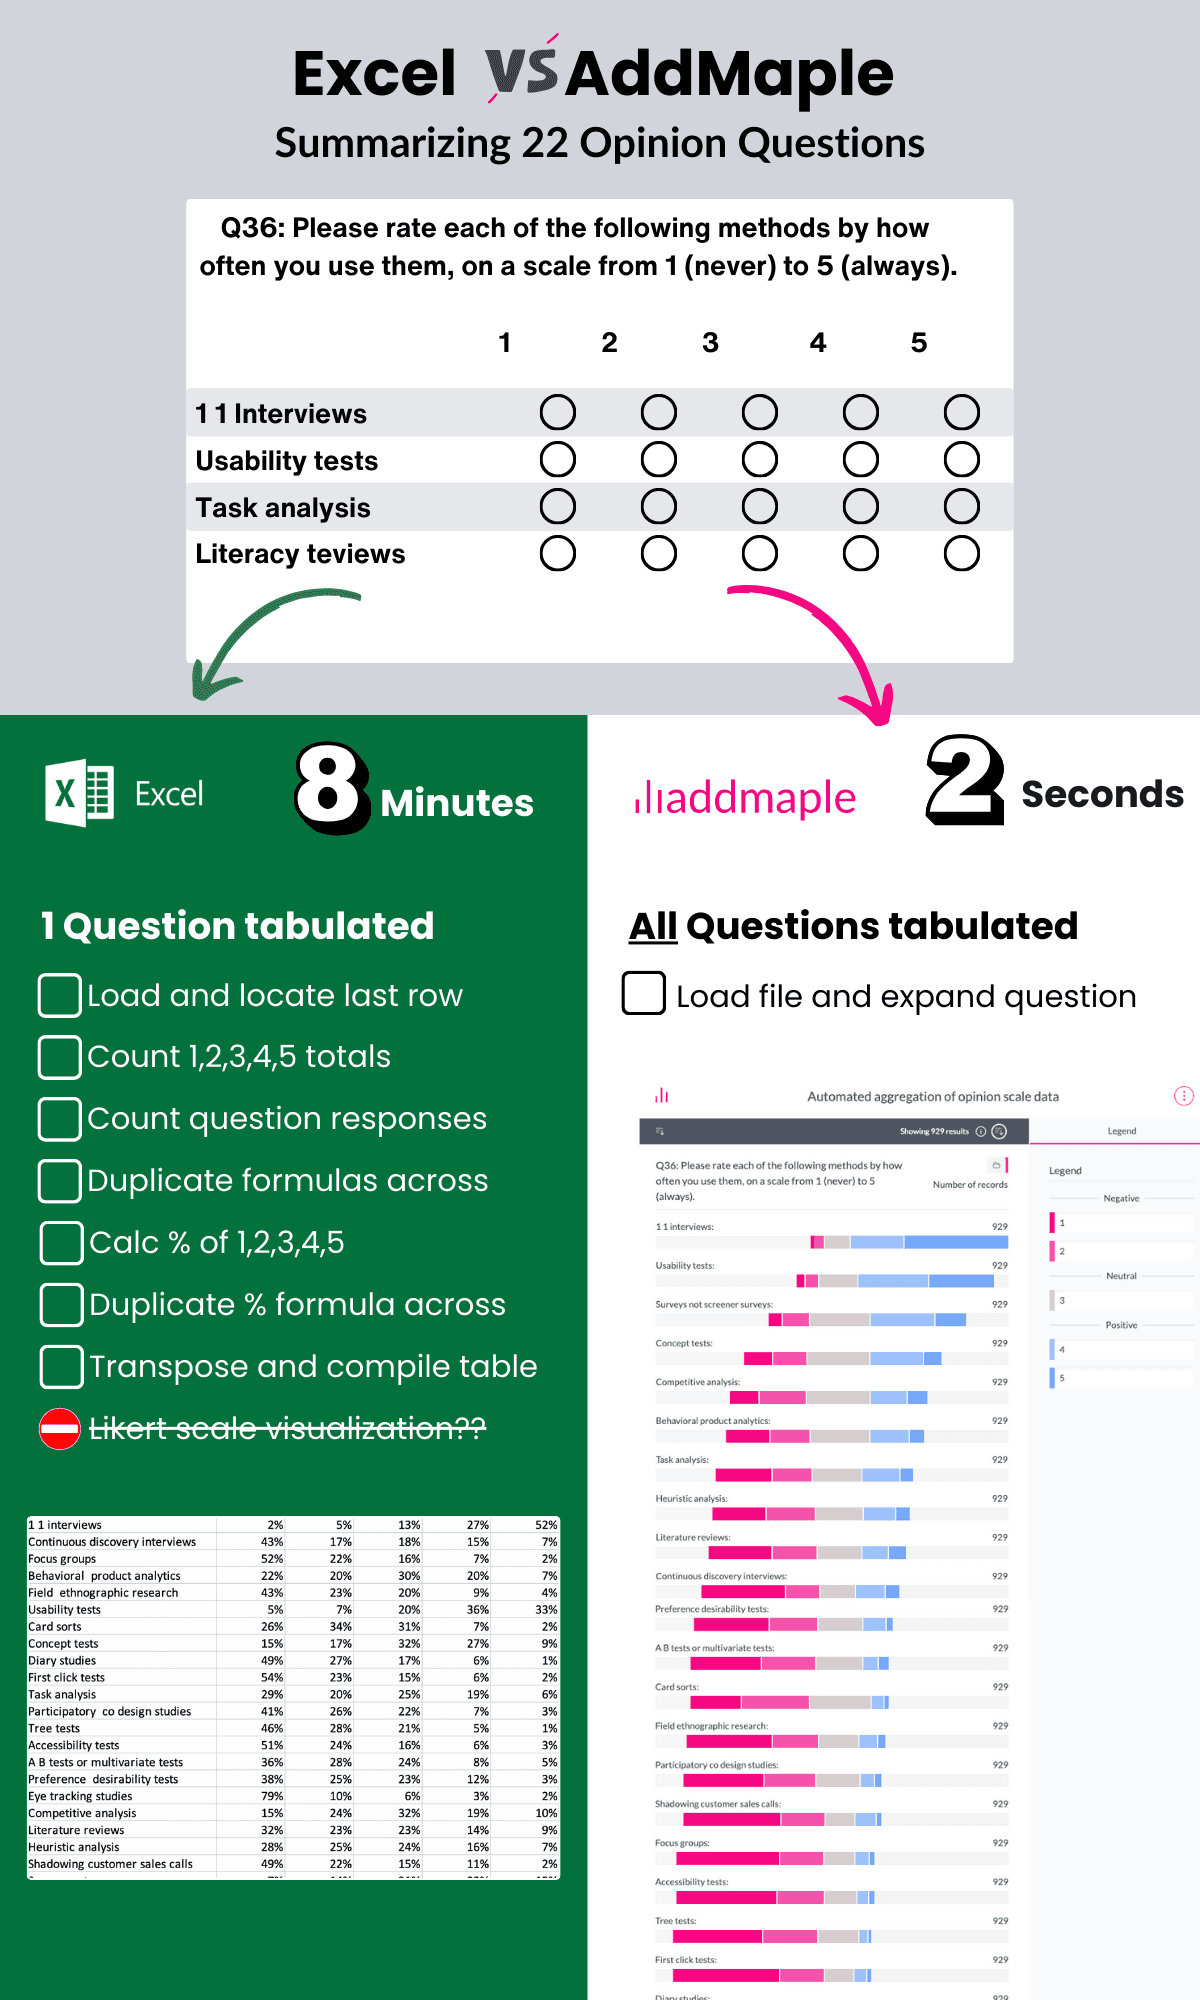
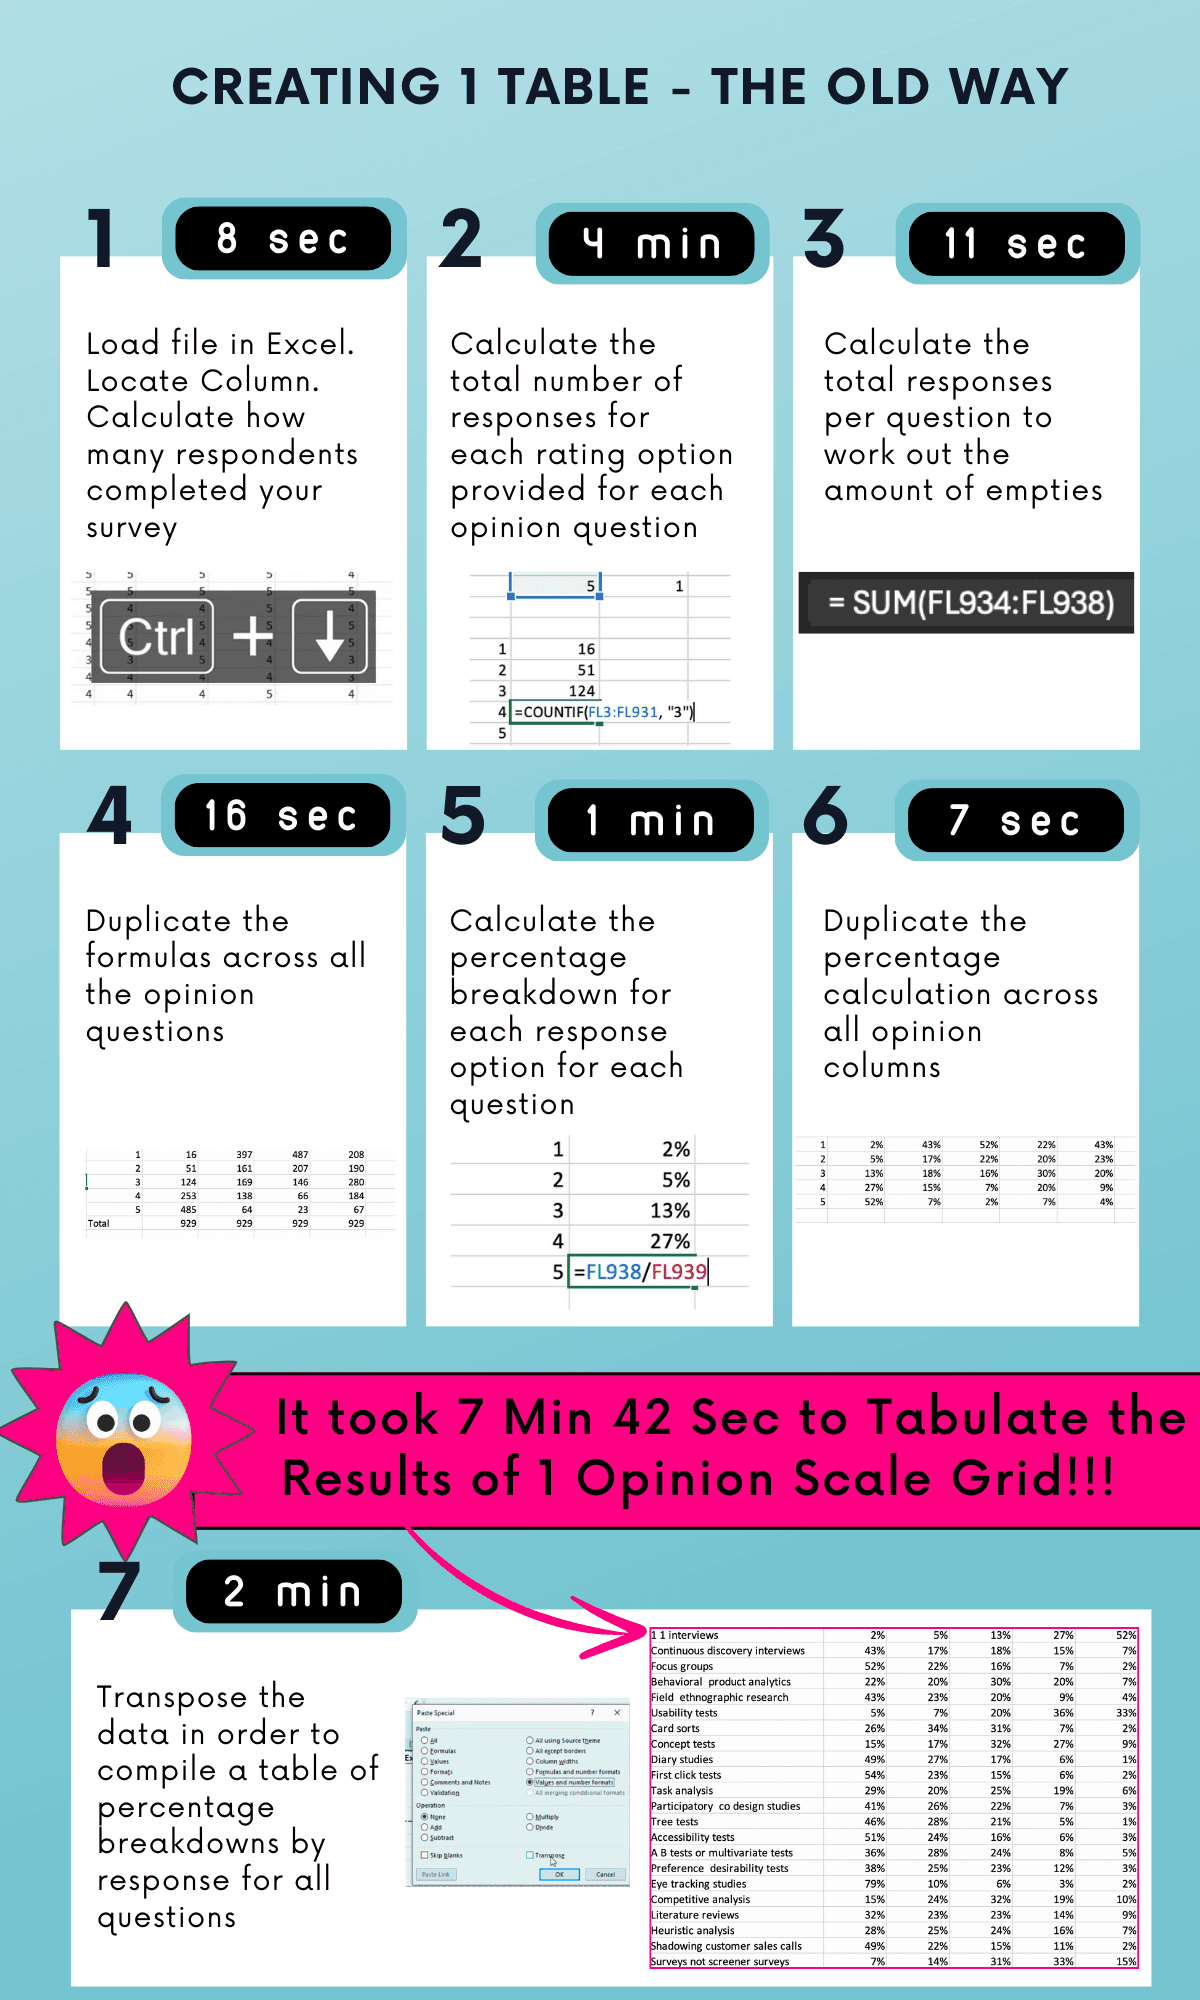
Analyzing Typeform surveys shouldn't start with messy columns and setup tasks. AddMaple instantly summarizes your results into tables, pivots, and charts. Whether you're working with ranking, Likert scales, or open-ended questions, you'll be exploring insights, not formatting spreadsheets.
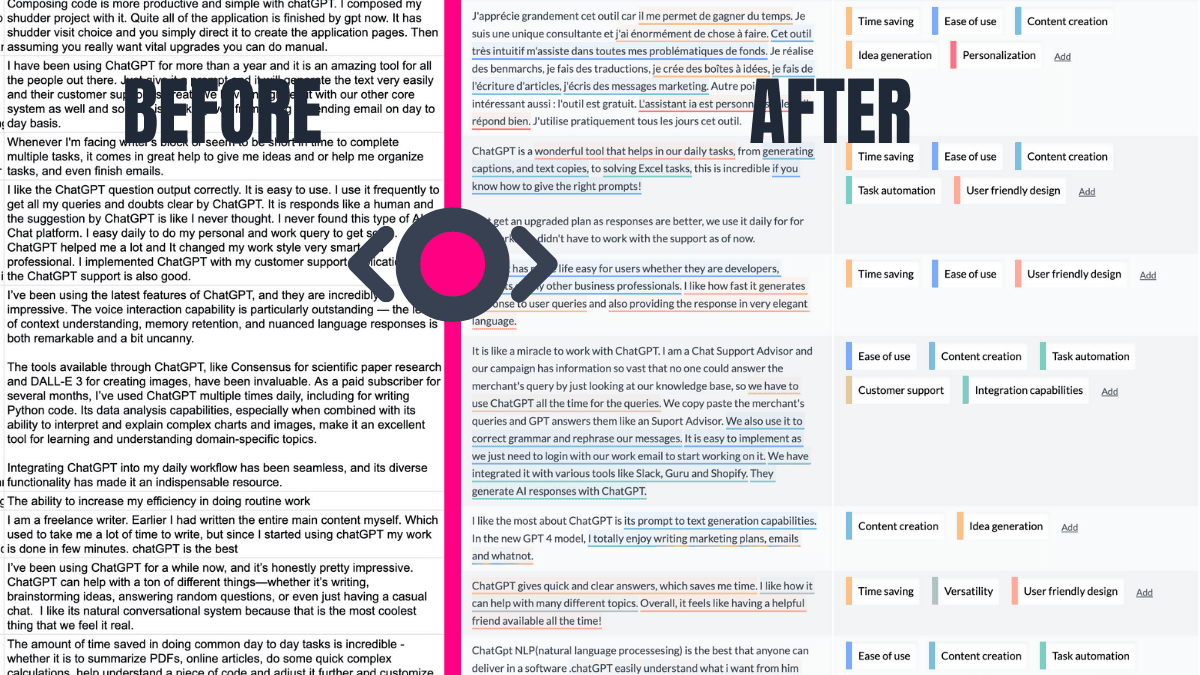
AI-Powered Insights for Open-Ended Questions
Stop spending hours manually reviewing text responses. AddMaple's AI automatically organizes open-ended answers into meaningful themes and even highlights key phrases. Whether it's 10 responses or 10,000, AddMaple turns unstructured text into clear, actionable insights.
Instant Segmentation by Any Variable
Want to filter by demographics, time, or any other response? AddMaple makes segmentation easy and intuitive, helping you compare subsets of data effortlessly. No more exporting to Excel or struggling to connect questions to answers—it's all built-in.
Smart Handling for Ranking Questions
AddMaple transforms Typeform's ranking data into digestible insights. Automatically pivot by any category—like country or department—and get clear, comparative visuals that eliminate the guesswork.
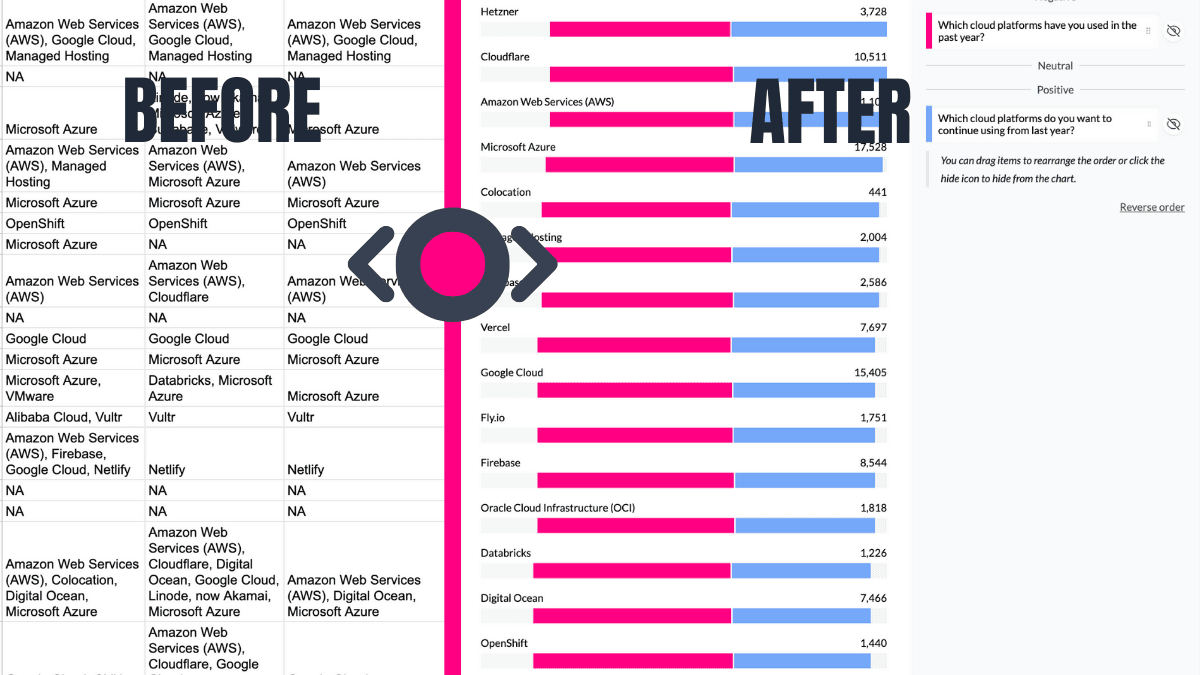
Automated Multi-Select Analysis
Struggling to summarize "Select all that apply" questions? AddMaple detects multi-tag responses and turns them into interactive, clear charts without manual work. You'll never have to split columns or write complex formulas again.
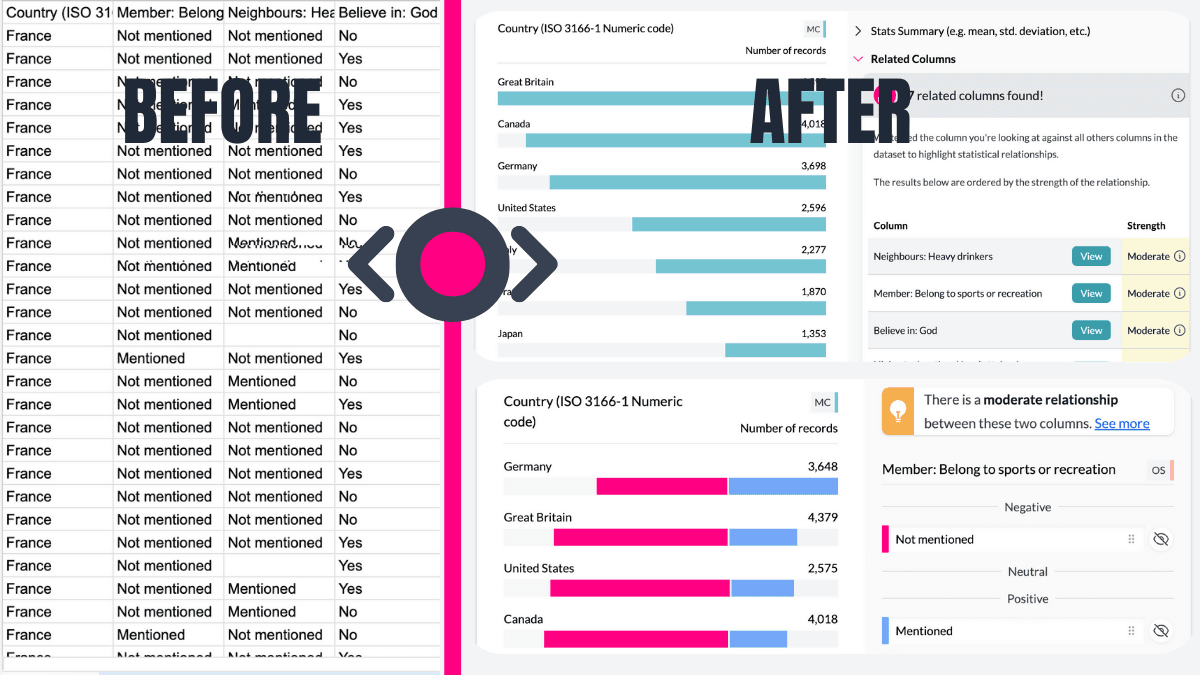
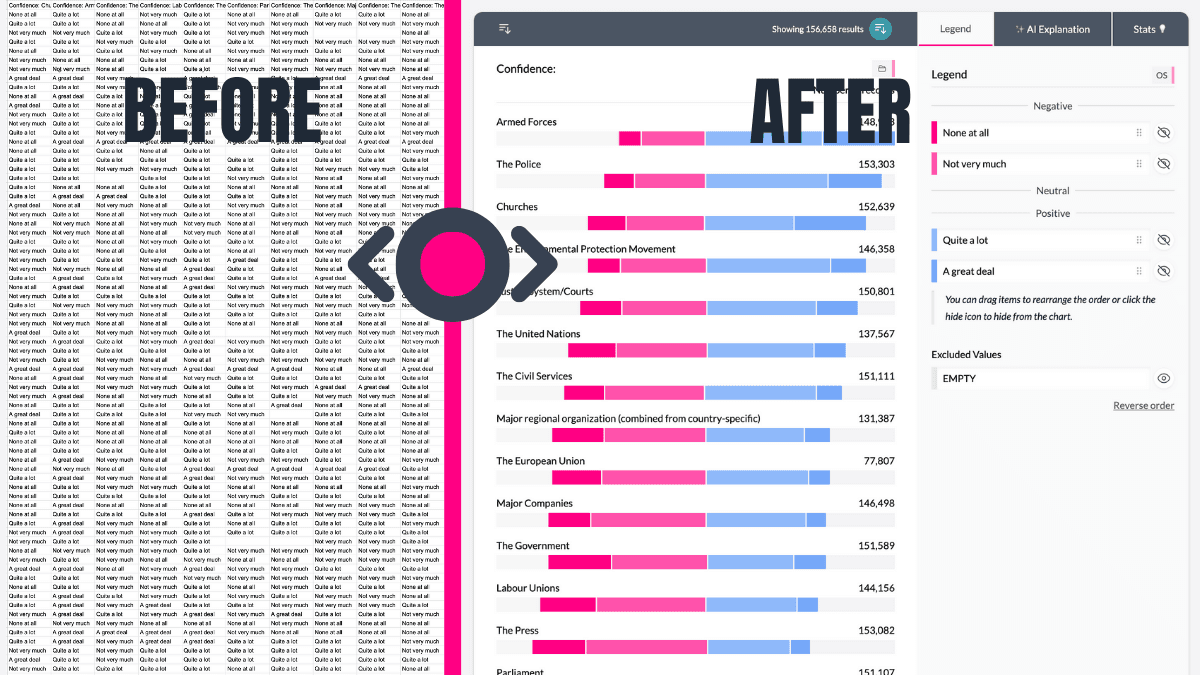
Spot Trends That Matter Most
With AddMaple, you're not just seeing raw data—you're uncovering what's important. Statistical significance tests and ranked relationships guide you to the key insights in your survey, fast.
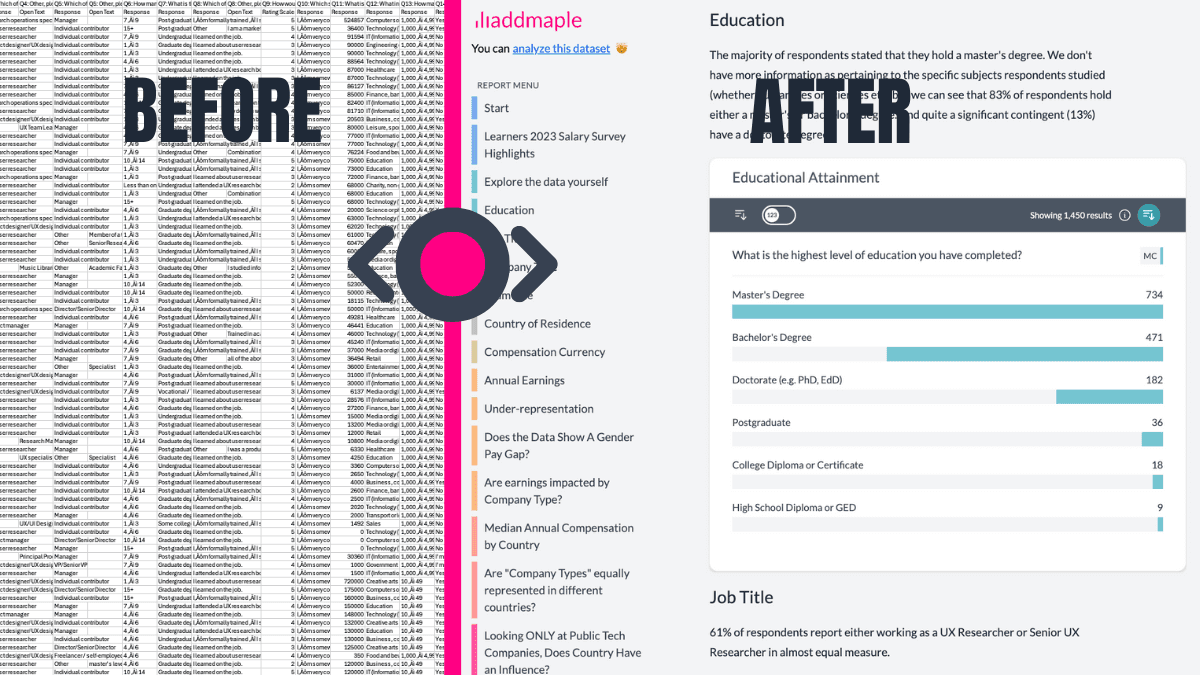
Interactive Reports That Wow Your Team
AddMaple helps you go beyond static reports with interactive dashboards and shareable charts. Your findings stay engaging and accessible for teams, clients, or stakeholders—making your data truly impactful.
AddMaple creates instant chart dashboards that let you analyze your survey data visually and is one of the best ways I've found to conduct AI-powered thematic analysis of open-ended results.


AddMaple: One Platform for All Your Typeform Analysis Needs
Stop juggling multiple tools to analyze your Typeform data.
AddMaple combines powerful visualizations, AI-driven insights, and advanced statistics to help you understand your survey responses better - all in one place.
Effortless Analysis of Any Question Type
From ranking questions to open-ended responses, AddMaple automatically handles all Typeform question types with smart visualizations and insights.
Advanced Segmentation Made Simple
Slice and dice your data by any variable without complex formulas or external tools. Compare responses across demographics, time periods, or any other factor.
AI-Powered Text Analysis
Let AI automatically categorize and analyze your open-ended responses, turning thousands of comments into clear, actionable themes.
Features to keep you in flow
AddMaple automates data structuring and cleansing because it:
- handles empty cells grouping them off, bypassing the need for placeholder values
- identifies and summarizes diverse data types: numbers, currencies, dates, text, survey questions, duration, multiple choice, multi-select, matrix, opinions, grid questions and more
- recognizes data patterns: multi-select tags, word and phrase clusters within text responses, numeric data distribution and more
- buckets numeric data into appropriate bins based on their range and distribution, while identifying and restricting the impact of outliers
- summarizes double header or matrix columns for comprehensive analysis automatically
- sorts numeric data containing text descriptions, e.g. age categories containing words such as between, younger than, less than, older than etc.
- supports CSV, Excel & SAV (SAV labels and meta data pulled in automatically)
From Raw Data to Explore Data
Secure by design
Your data stays on your system, with all analysis happening instantly in your browser, not in the cloud.
We support cloud based chart and report sharing - but this is optional and fully within your control. Read more about our approach to security and privacy here.
The fastest data analysis tool out there
Built from the ground-up to be super speedy. No more loading spinners, crashing spreadsheets or scrambled sorting.
Don't believe us? Try this Afrobarometer dataset with over 20 million data points fully loaded and summarized in 2.84 seconds
A few of the 20,000+ people cruising from data exports to reports


Ready to Make Your Data Work for You?
See how AddMaple can speed up your survey analysis and help you uncover meaningful insights.
Receive tips for your next data project