Business plans for teams and agencies
Business-ready survey analysis from $5k/year.
Collaboration, secure publishing, trackers, and SSO in one team workspace. Built for serious delivery and governance.
- Instant exploration with pivots, filters, and key drivers
- Explainable AI themes you can audit and refine
- Secure sharing with unlimited viewers on Business
Local-first by default. GDPR-aligned. Google SSO and enterprise SSO available on Business.

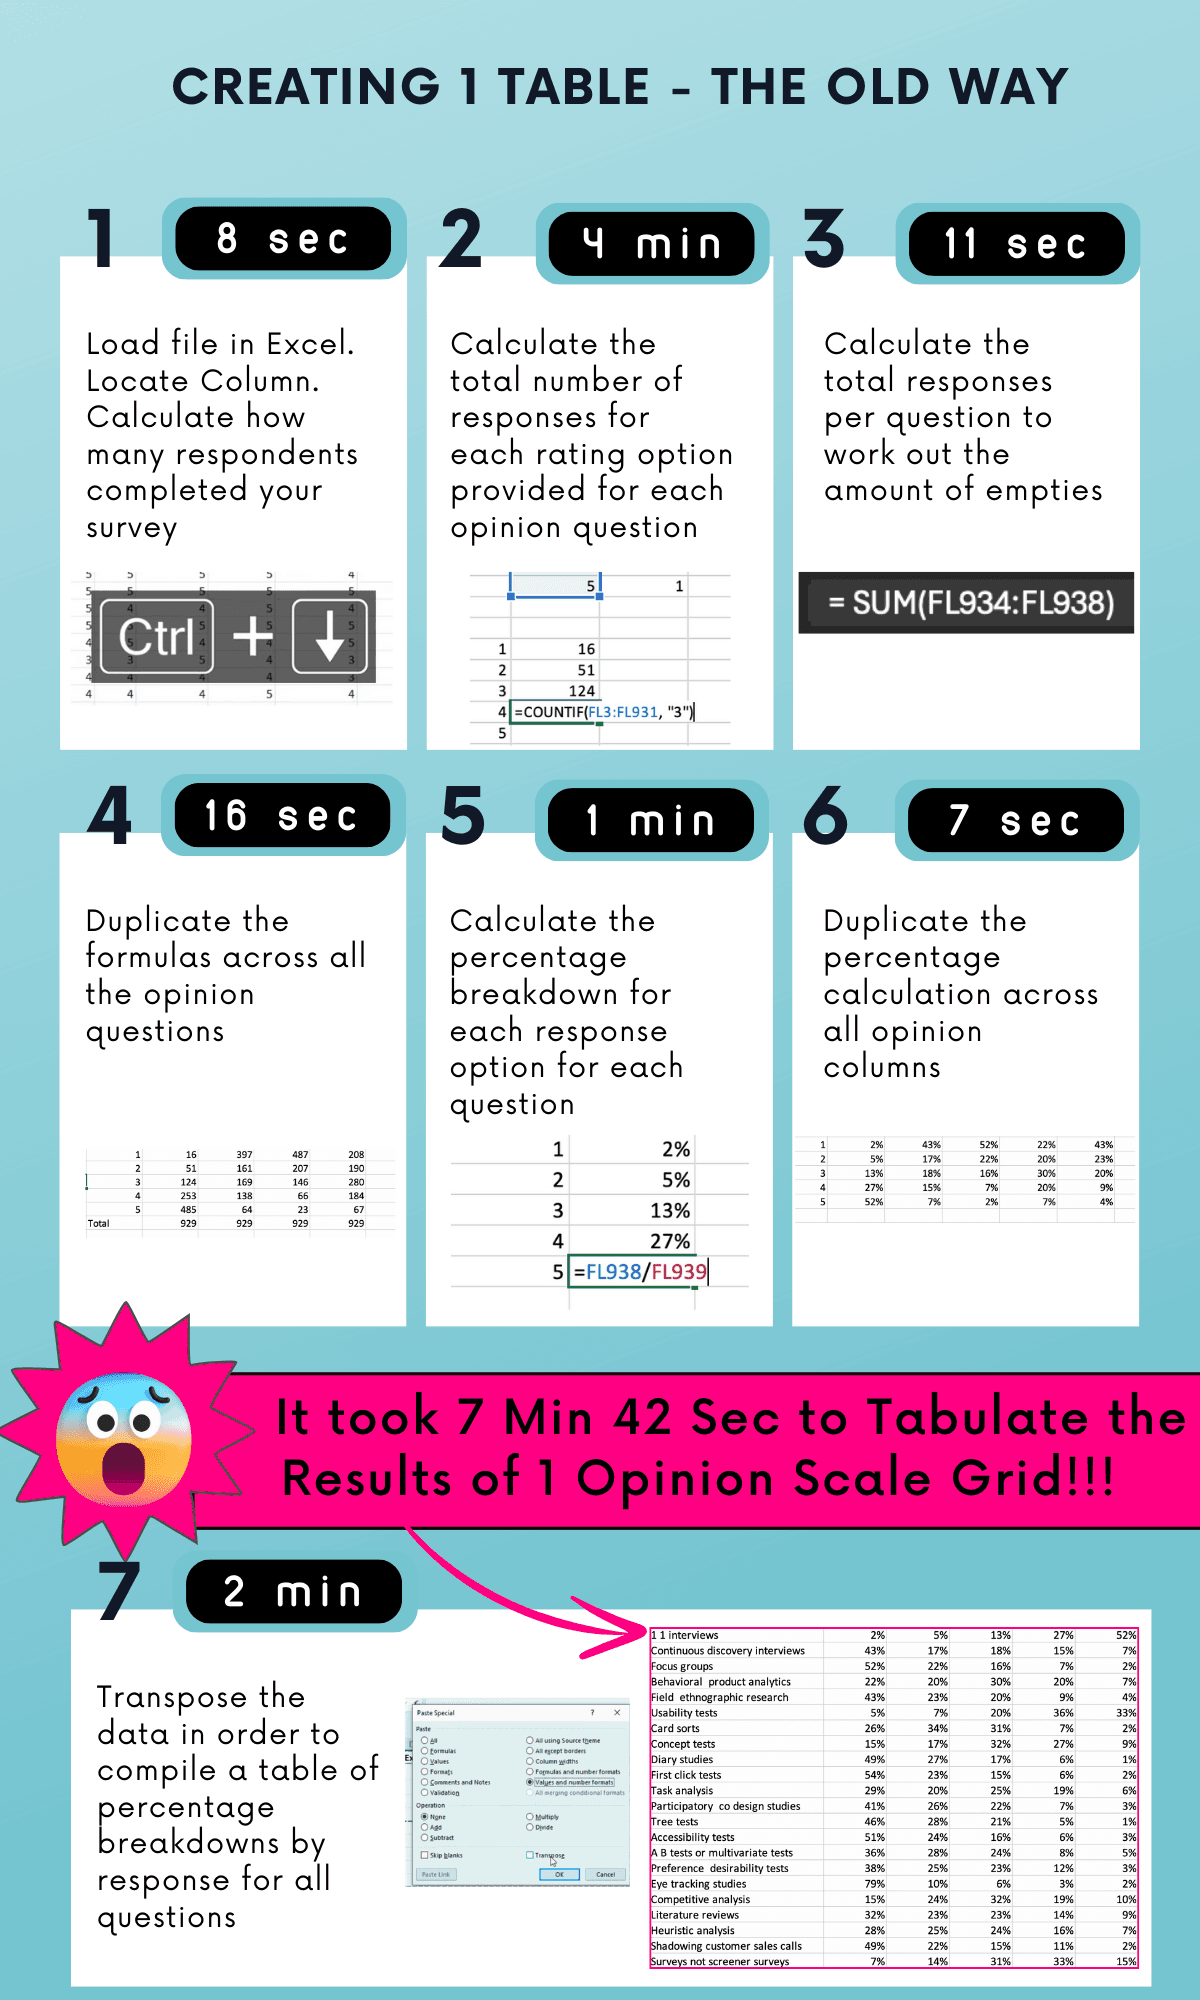
Replaced 20 years of Tableau workflows. Analysis cycles dropped from weeks to minutes, and clients engage with deliverables instead of static decks.
Susan Baier
Founder & CEO, Audience Audit
What Business includes
A clear path for teams that need secure sharing, governance controls, and scalable delivery.
- Team workspace, permissions, and comments
- Private dashboards with password-protected sharing
- Unlimited dashboard viewers
- Google SSO and enterprise SSO options
- Multi-file projects and trackers
- Local-first data handling and AI column controls
Why Survey Insights Get Stuck
Most teams still combine too many tools and too much manual setup before they can trust and share findings.
Too much analysis time lost to data prep.
Open-ended feedback lives outside quant workflows.
Stakeholders receive static outputs and ask for reruns.
Defensibility and traceability are hard to show quickly.
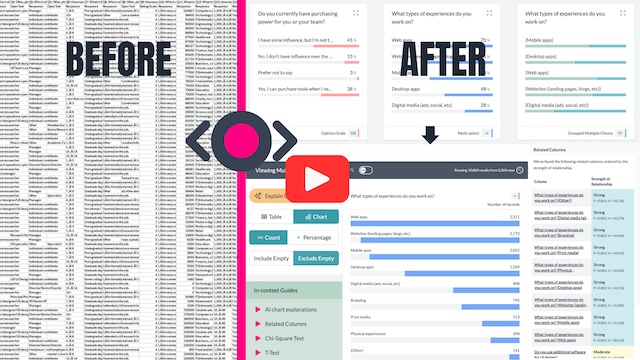
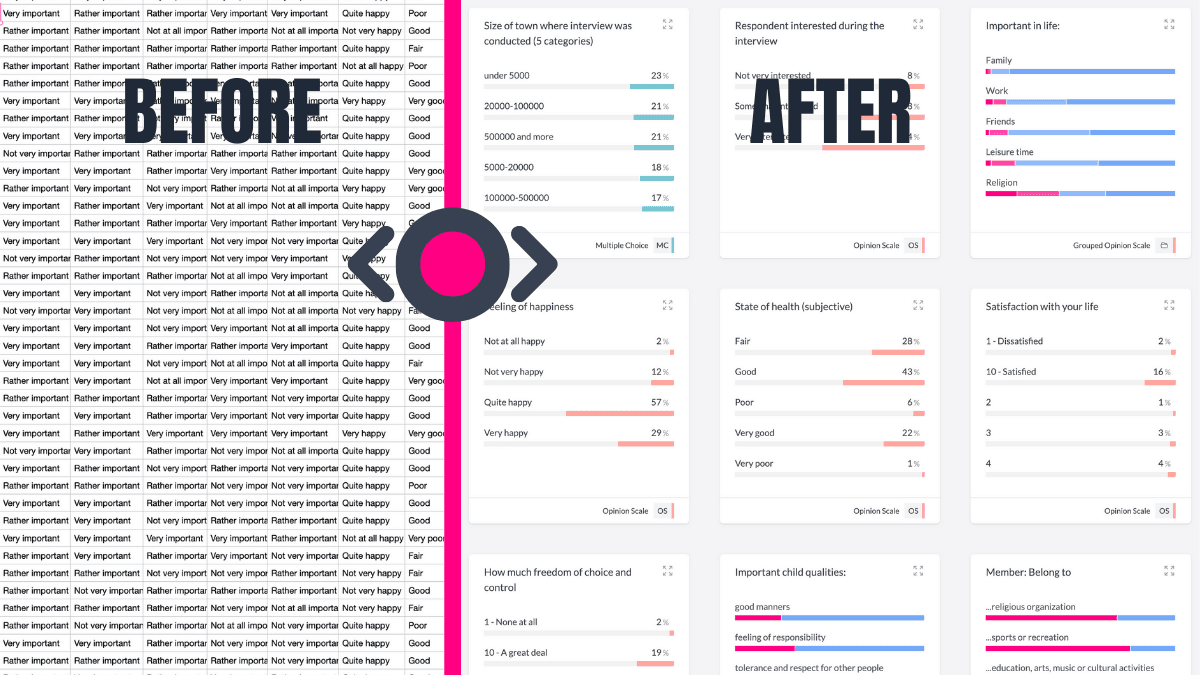
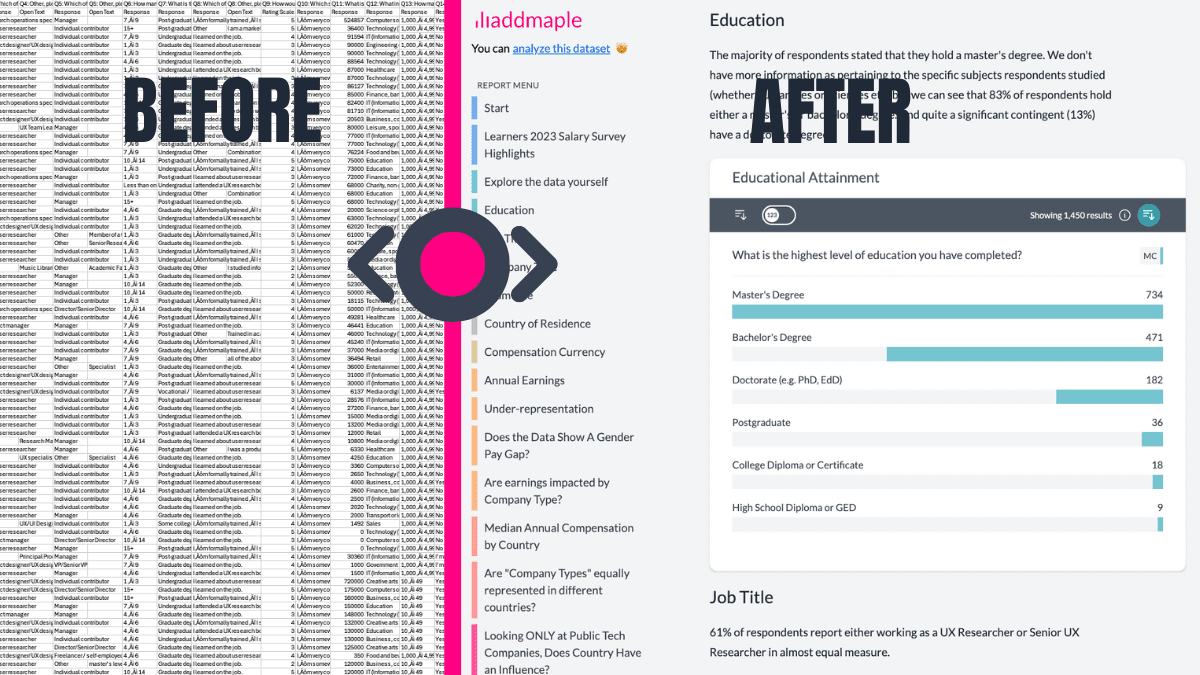
Starts You with Summarized Data
Upload CSV, SAV, or Excel and start with charts, tables, and pivots immediately. No setup project or data wrangling sprint before analysis.
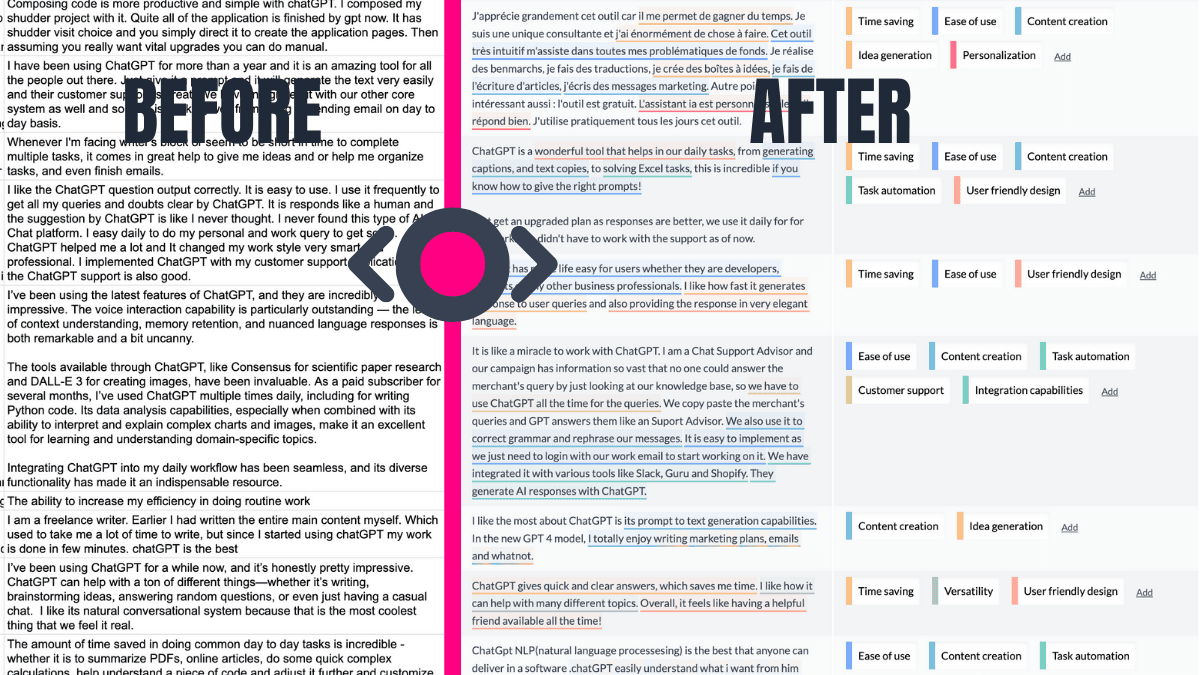
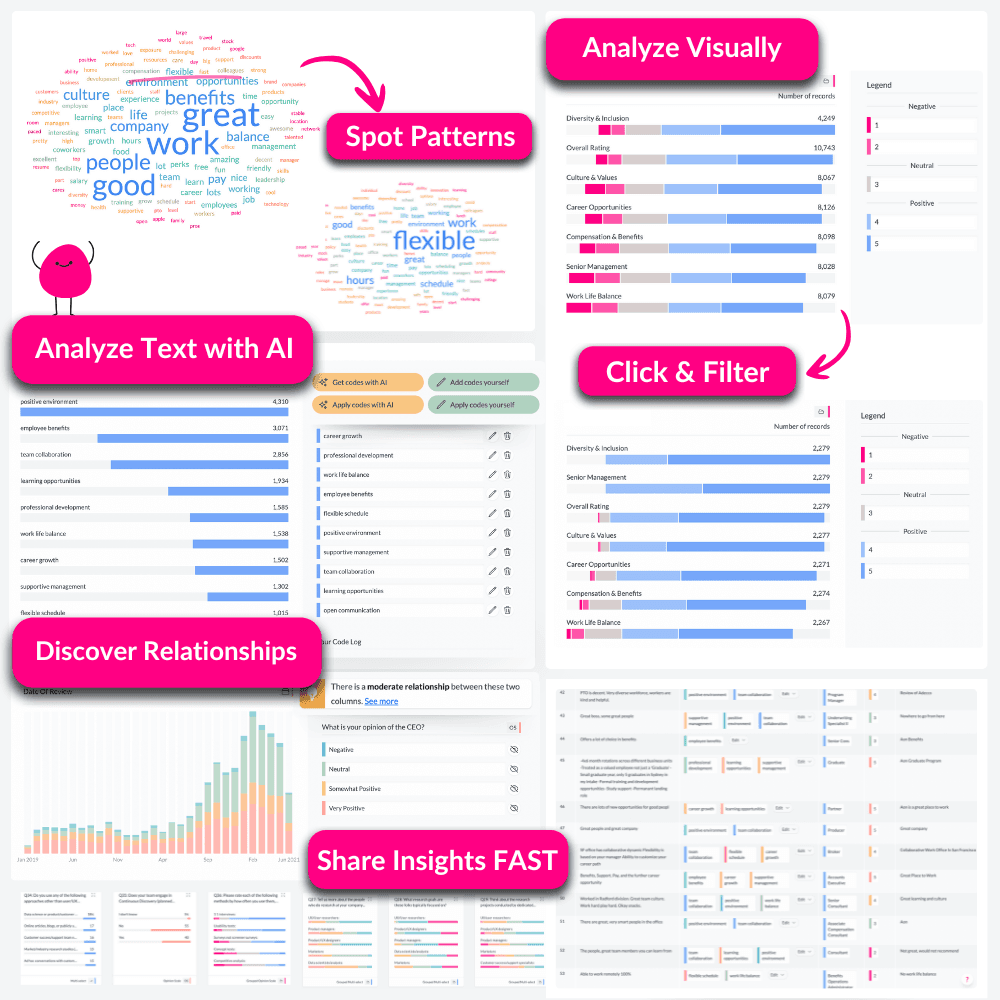
Explainable AI Thematic Coding
Generate open-end themes in minutes, then audit the source phrases behind every theme. Keep control with traceable and editable coding.
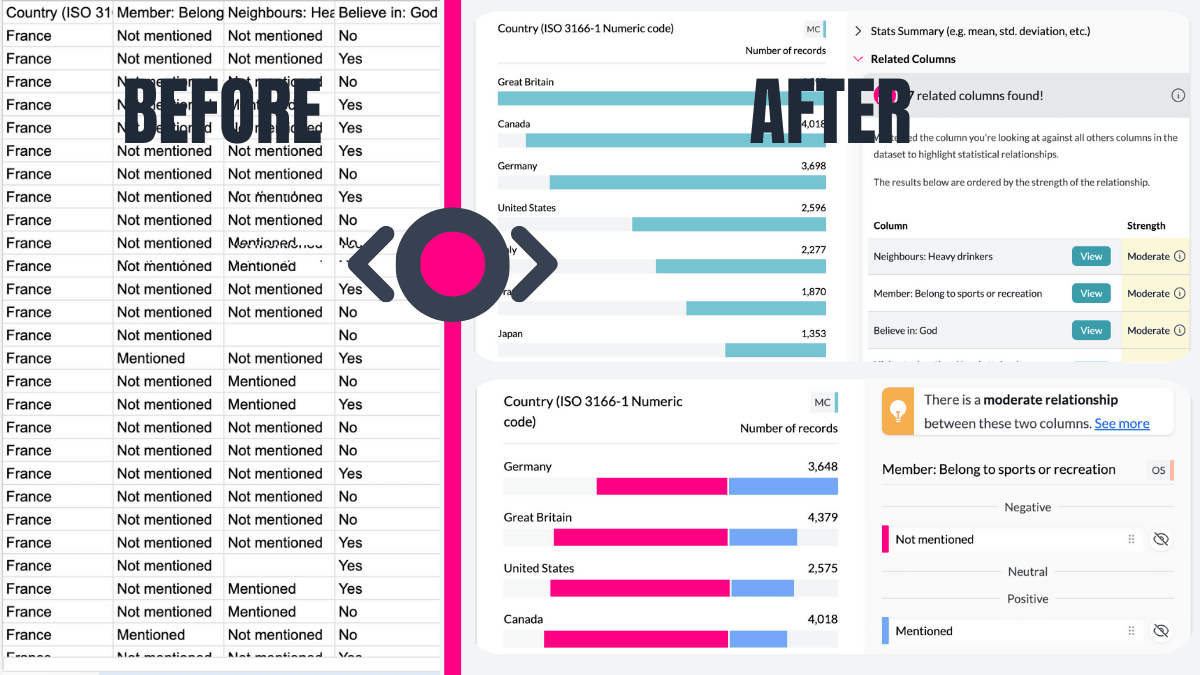
Significance and Key Driver Discovery
Run significance checks across your data and rank what is truly associated with outcomes like NPS, CSAT, and adoption.
Shareable Dashboards and Story Views
Publish secure, explorable views for stakeholders and clients. Share links instead of static slides and keep everyone on the latest data.
Integrations
Bring your data to us from any platform and get an instant explore-ready dashboard


AddMaple creates instant chart dashboards that let you analyze your survey data visually and is one of the best ways I've found to conduct AI-powered thematic analysis of open-ended results.


AddMaple: From Survey Export to Decision-Ready Insight
AddMaple combines quant analysis, open-end coding, and interactive sharing in one workflow so teams can move from file to action quickly.
Import and Explore Immediately
Bring your survey data in and start filtering, slicing, and validating results in seconds.
Analyze Qual + Quant Together
Keep themes linked to their quantitative context so findings are easier to explain and defend.
Publish Findings Without Rework
Share secure dashboards and editable outputs so follow-up questions do not create a new analysis cycle.
Share Findings That Stay Useful
Create outputs that stakeholders can explore, question, and revisit. Replace static attachments with living analysis.
Interactive by Default
Recipients can click, filter, and answer follow-up questions without waiting on analysts.
Always Up to Date
When your data updates, dashboards stay current without manual report reassembly.
Built for Internal and Client Reviews
Use the same analysis layer for team decision-making and external readouts.
Features to keep you in flow
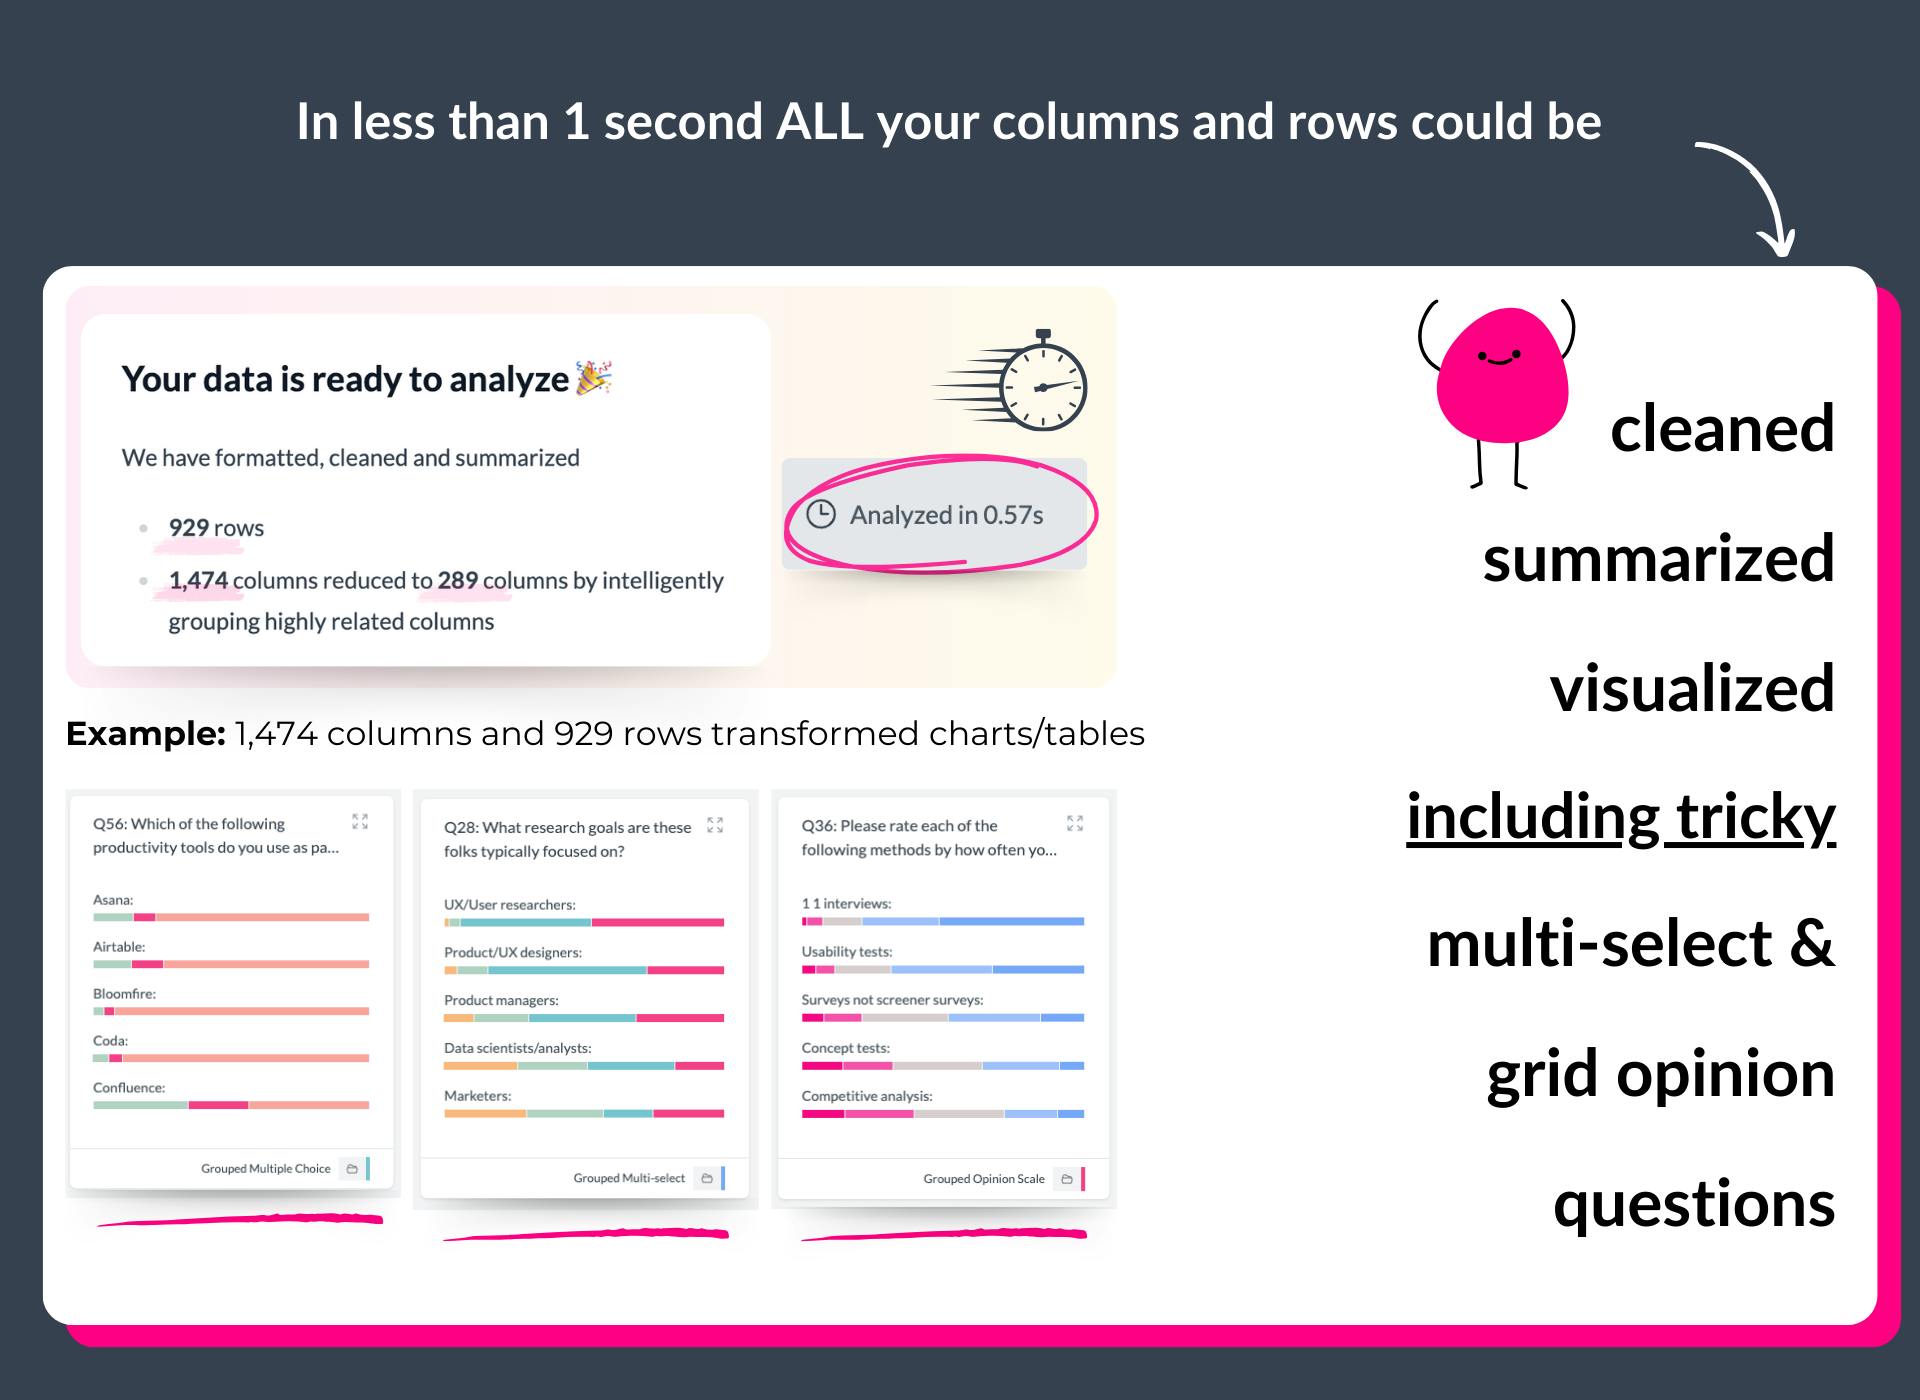
AddMaple automates data structuring and cleansing because it:
- handles empty cells grouping them off, bypassing the need for placeholder values
- identifies and summarizes diverse data types: numbers, currencies, dates, text, survey questions, duration, multiple choice, multi-select, matrix, opinions, grid questions and more
- recognizes data patterns: multi-select tags, word and phrase clusters within text responses, numeric data distribution and more
- buckets numeric data into appropriate bins based on their range and distribution, while identifying and restricting the impact of outliers
- summarizes double header or matrix columns for comprehensive analysis automatically
- sorts numeric data containing text descriptions, e.g. age categories containing words such as between, younger than, less than, older than etc.
- supports CSV, Excel & SAV (SAV labels and meta data pulled in automatically)
From Raw Data to Explore Data
Secure by design
Your data stays on your system, with all analysis happening instantly in your browser, not in the cloud.
We support cloud based chart and report sharing - but this is optional and fully within your control. Read more about our approach to security and privacy here.
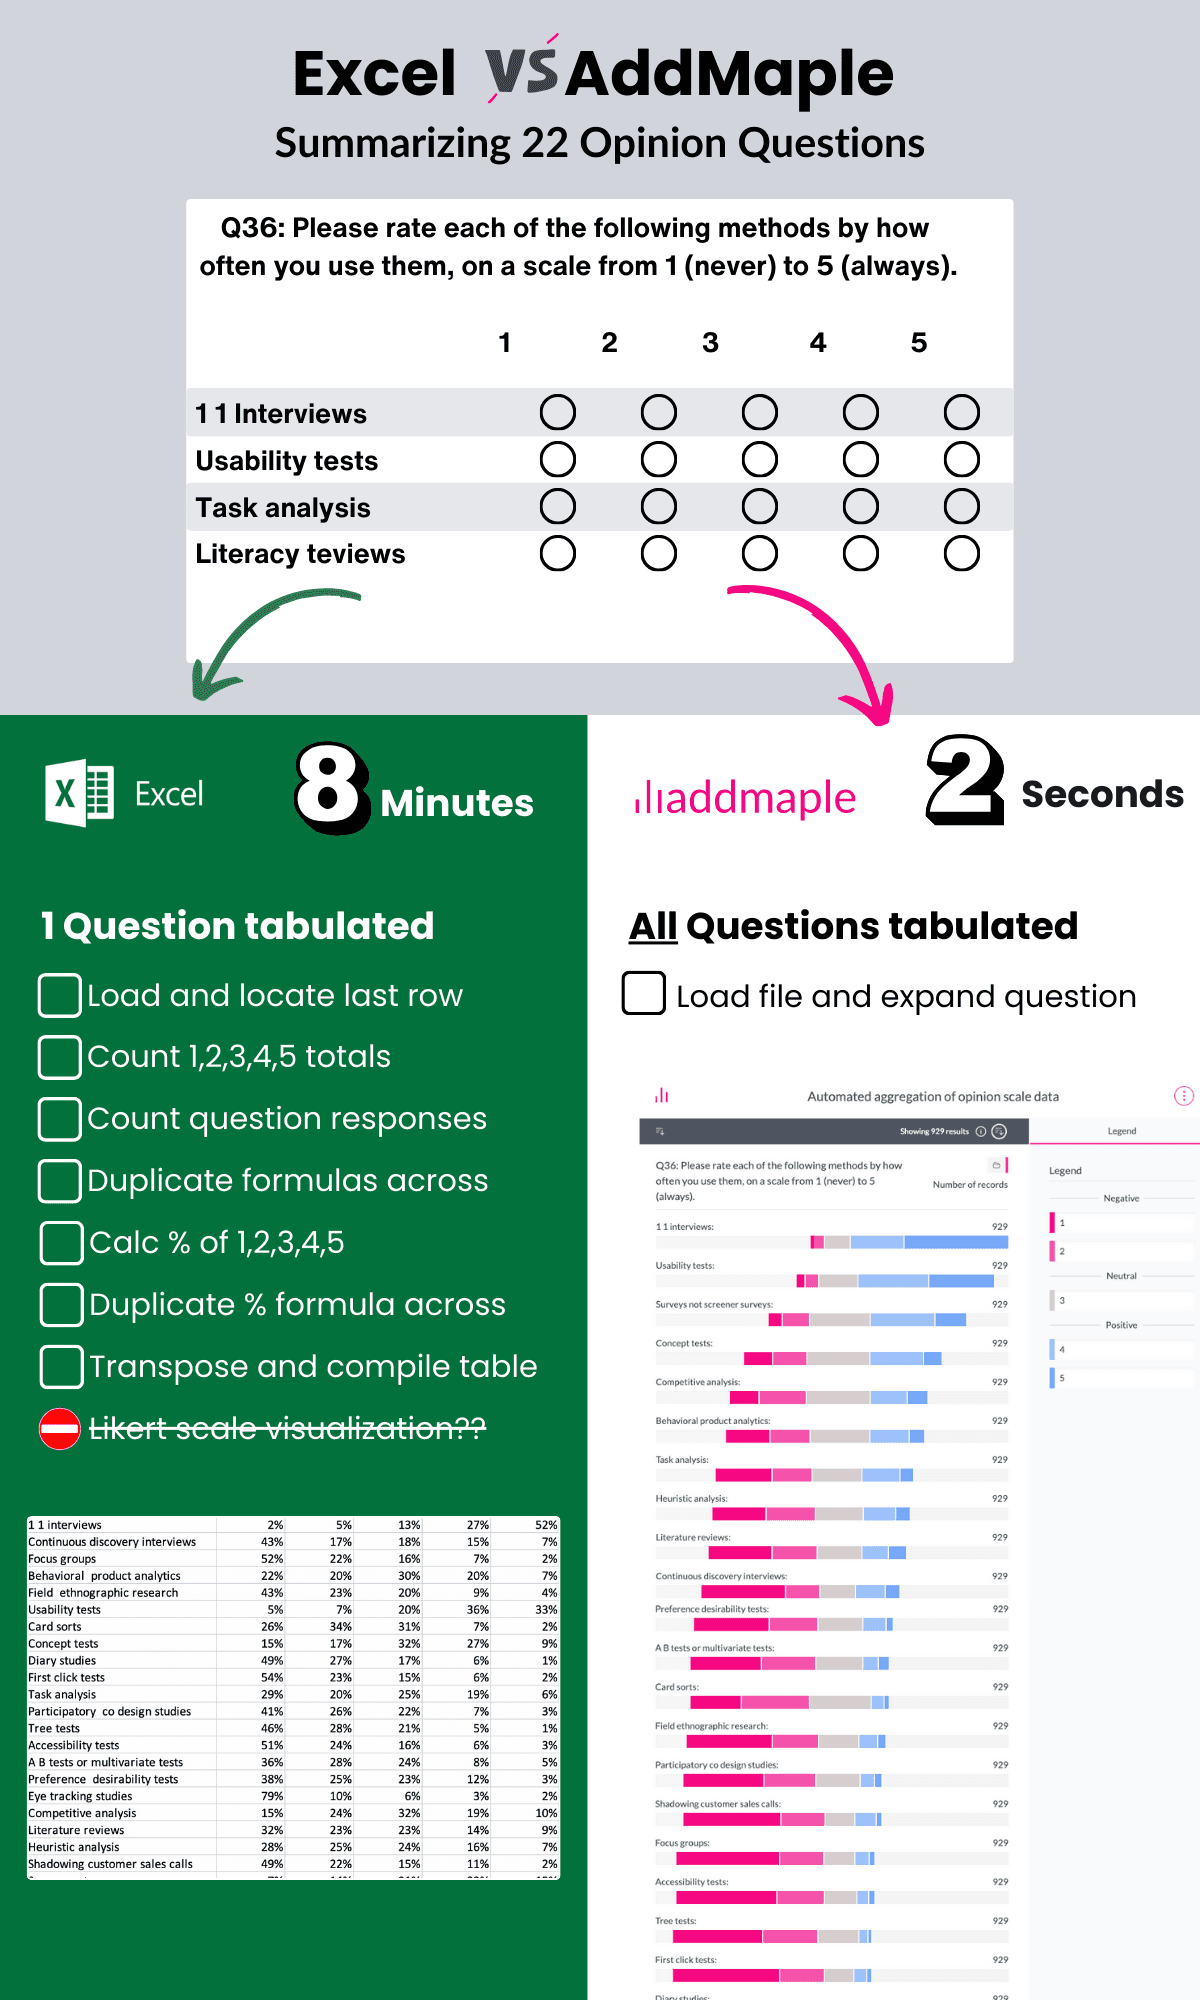
The fastest data analysis tool out there
Built from the ground-up to be super speedy. No more loading spinners, crashing spreadsheets or scrambled sorting.
Don't believe us? Try this Afrobarometer dataset with over 20 million data points fully loaded and summarized in 2.84 seconds
A few of the 20,000+ people cruising from data exports to reports


Ready to Make Your Data Work for You?
See how AddMaple can speed up your survey analysis and help you uncover meaningful insights.
Receive tips for your next data project