
Traditional Crosstab Cycle
- Data Processing starts
- Request crosstabs often without seeing the data
- Wait for tabulations / DP
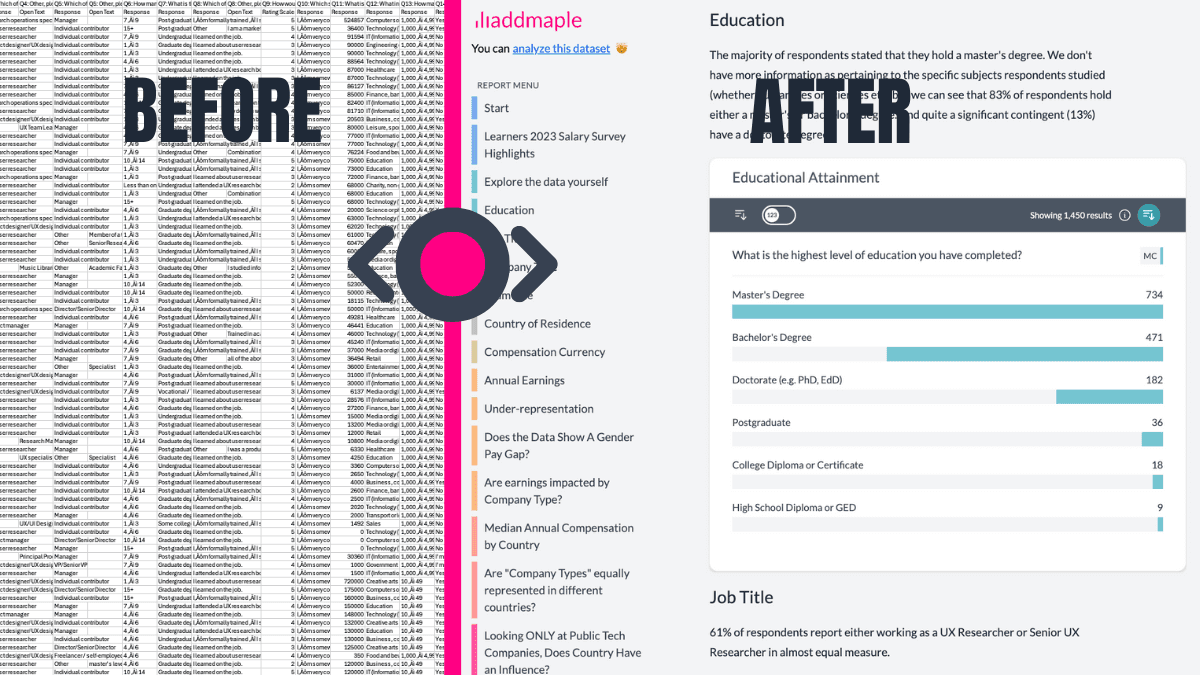
- Receive static spreadsheets
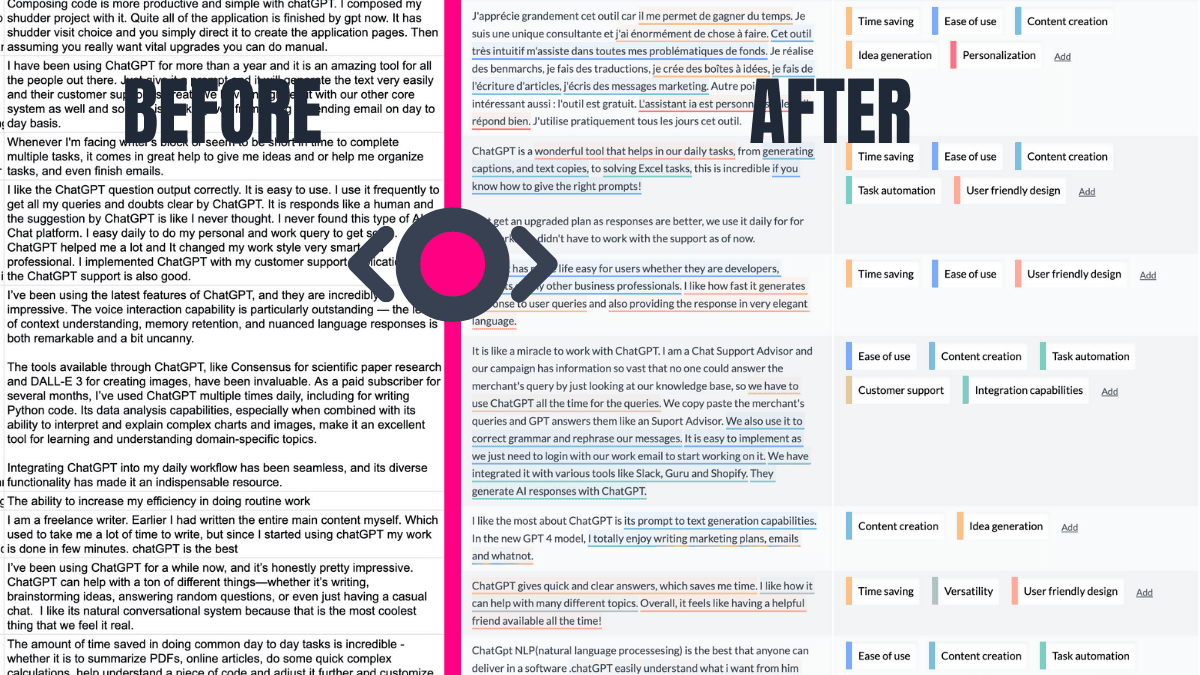
- Scroll through hunting for significant differences
- New question appears → request new crosstabs again
You drown in tables. Blind spots accumulate. Time and cost compound.