

Skip the variable setup sprint
Likert grids, multi-selects, and text columns are detected on import. You are not in Variable View defining labels and measurement levels before your first chart.

For the survey work you do every week
SPSS is built for statistical depth and syntax automation. AddMaple is built for the ad-hoc projects where setup eats the deadline.
If SPSS feels heavy for a 200-response tracker debrief, AddMaple skips variable properties, Multiple Response sets, and menu-by-menu crosstabs. Upload SAV or CSV, pivot multi-selects correctly, code open ends, test significance with effect sizes, and share a filterable dashboard — then export back to SPSS when you need factor analysis or SEM.
Fast verdict
Keep SPSS for syntax-driven programs, heavy recoding, and advanced modeling. Use AddMaple when the project is mostly cross-tabs, multi-selects, open ends, and a dashboard due tomorrow.
AddMaple advantage
These are the friction points we hear most from researchers who still keep SPSS for modeling but reach for AddMaple on client deadlines.
Likert grids, multi-selects, and text columns are detected on import. You are not in Variable View defining labels and measurement levels before your first chart.
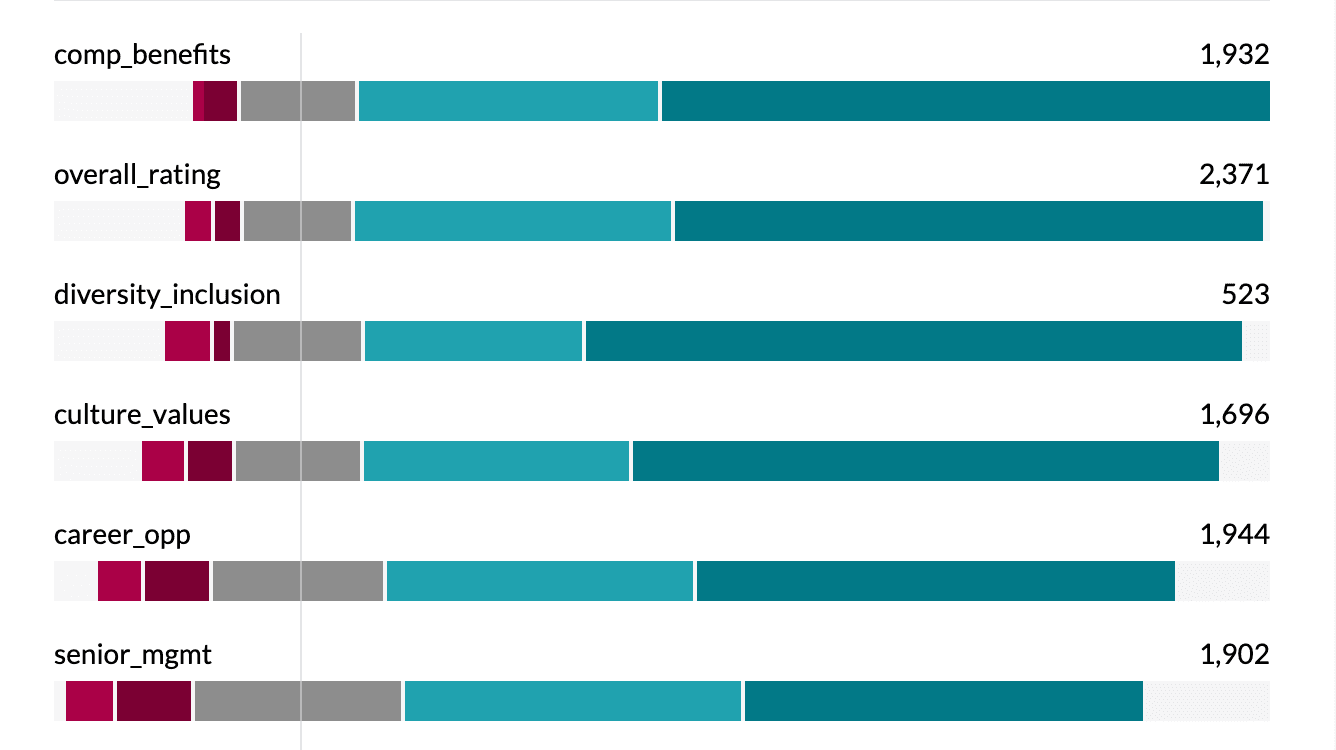
Pivot a multi-select column immediately with respondent-level logic. No dichotomous recodes, no Analyze → Multiple Response → Define Sets.
Theme clustering, sentiment, and verbatim summaries live beside your crosstabs — not in a Python script or manual codebook spreadsheet.
Workflow comparison
Compare what happens when a 200-response satisfaction survey needs cross-tabs, multi-select analysis, text themes, and a shareable dashboard by tomorrow.
Import and prepare
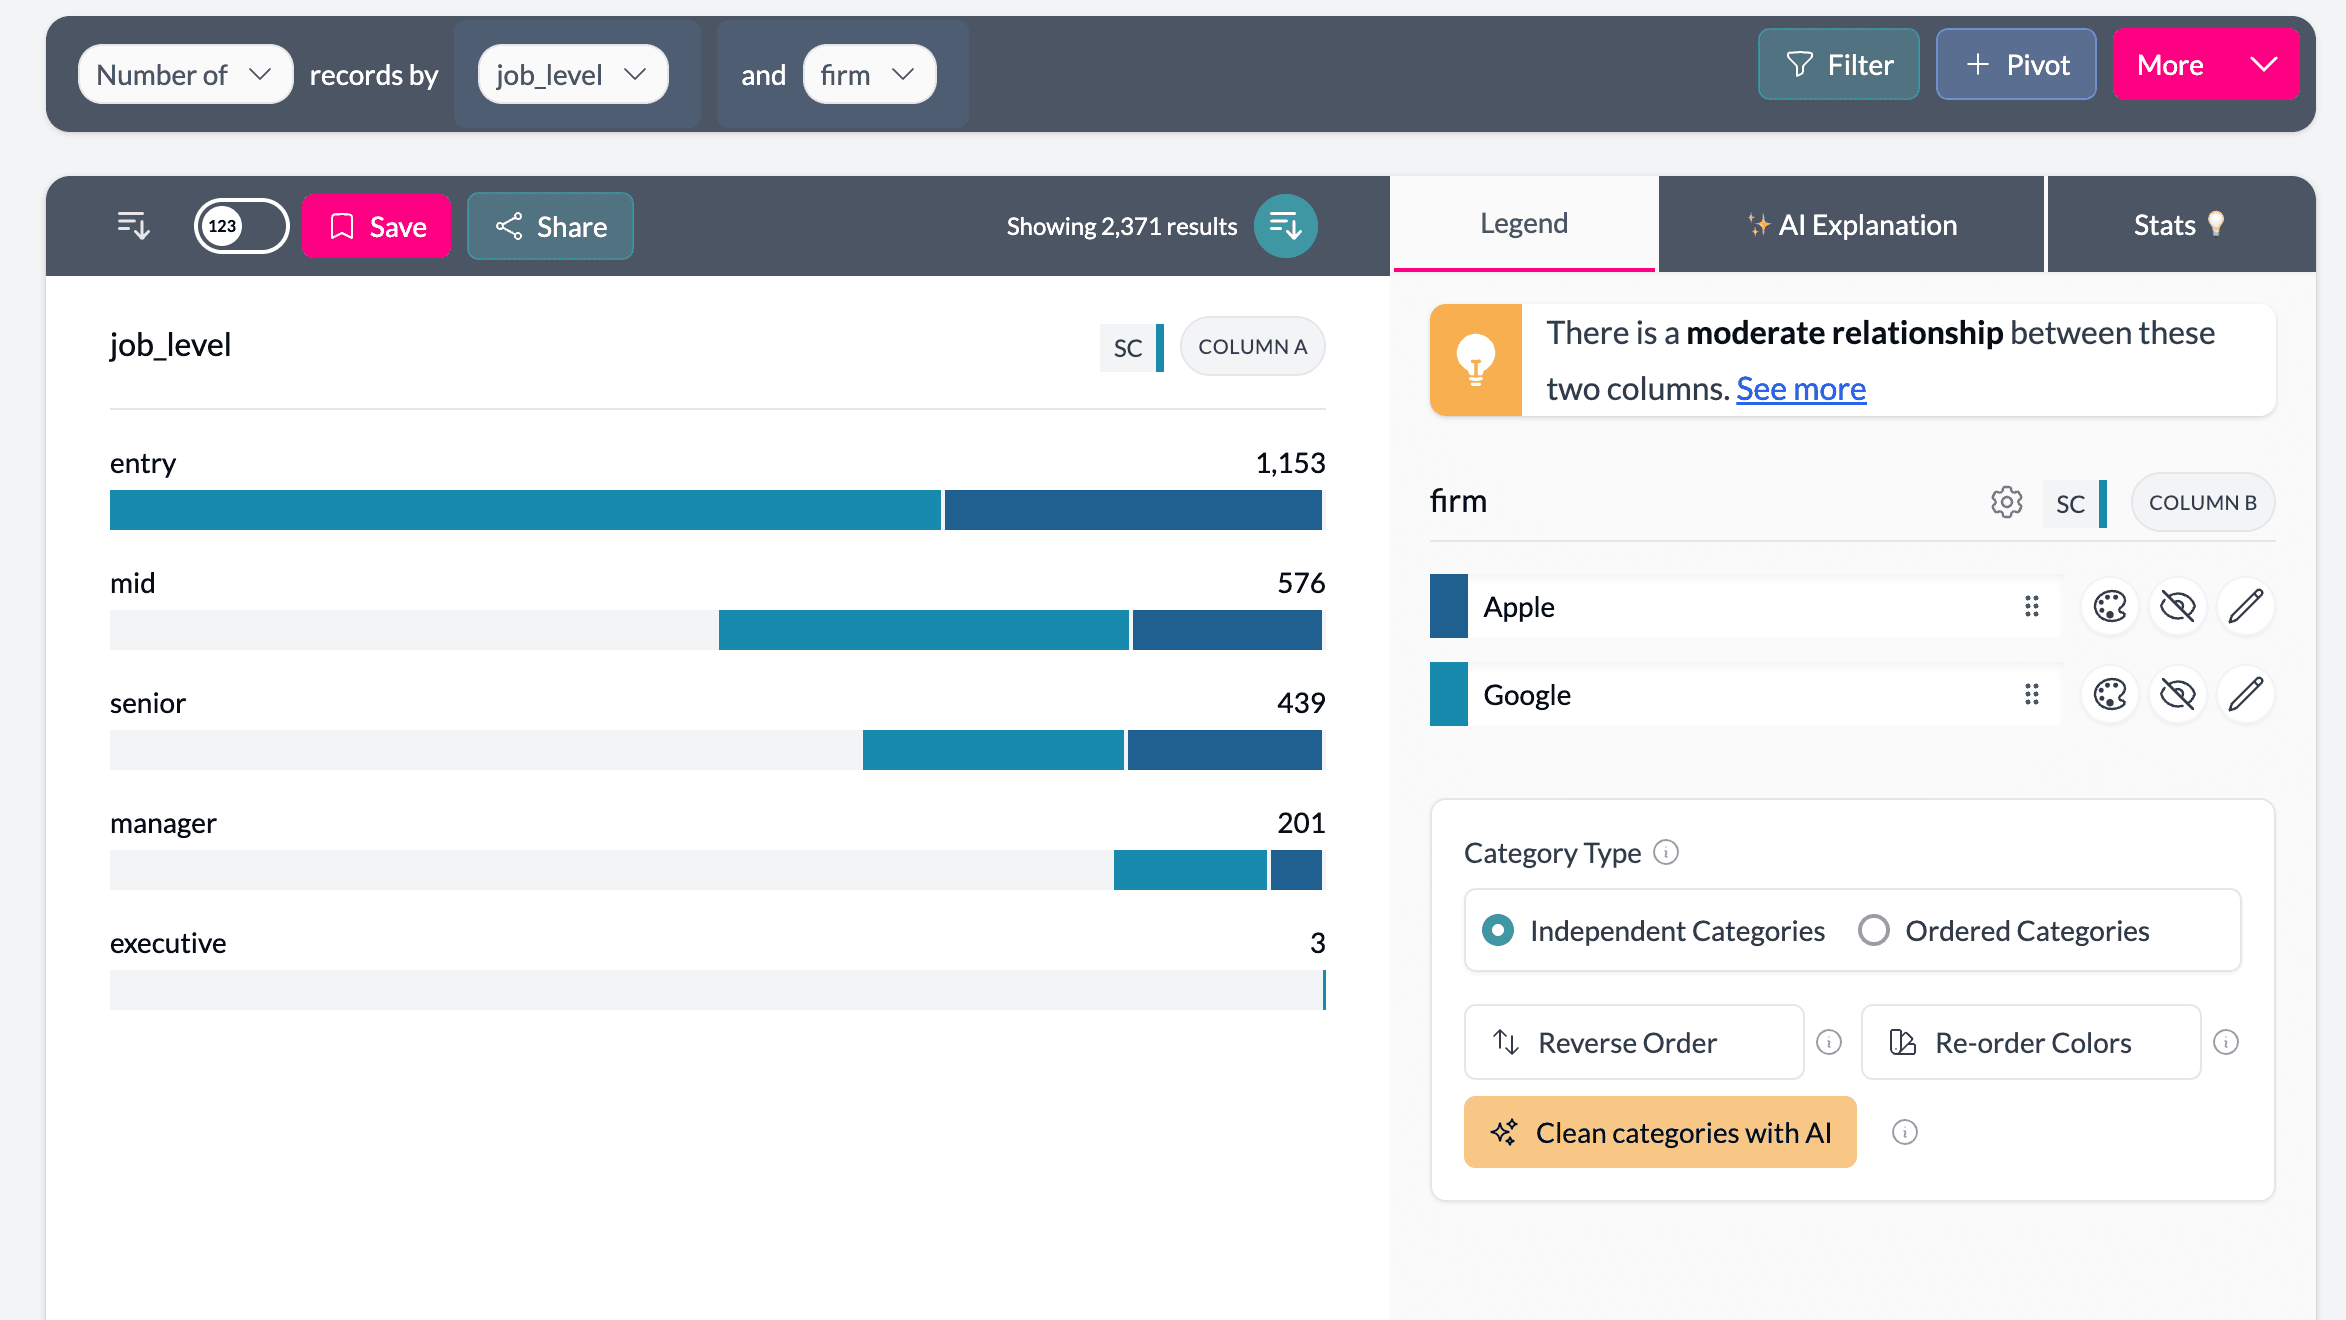
Upload SAV, CSV, or Excel. AddMaple detects Likert scales, multi-selects, and text columns, then prepares charts automatically.
Import the file, define variable properties, measurement levels, labels, and missing codes before analysis begins.
Handle multi-select
Pivot any multi-select column immediately. Respondents are counted correctly with no recoding or multiple response sets.
Recoding or Multiple Response sets are required. Setup is tedious and easy to misinterpret in output.
Build cross-tabs
Pivot any column against any other in one click. Filters update every chart and table instantly.
Each crosstab is Analyze → Descriptive Statistics → Crosstabs, with row/column percentages and test options configured per table.
Analyze open ends
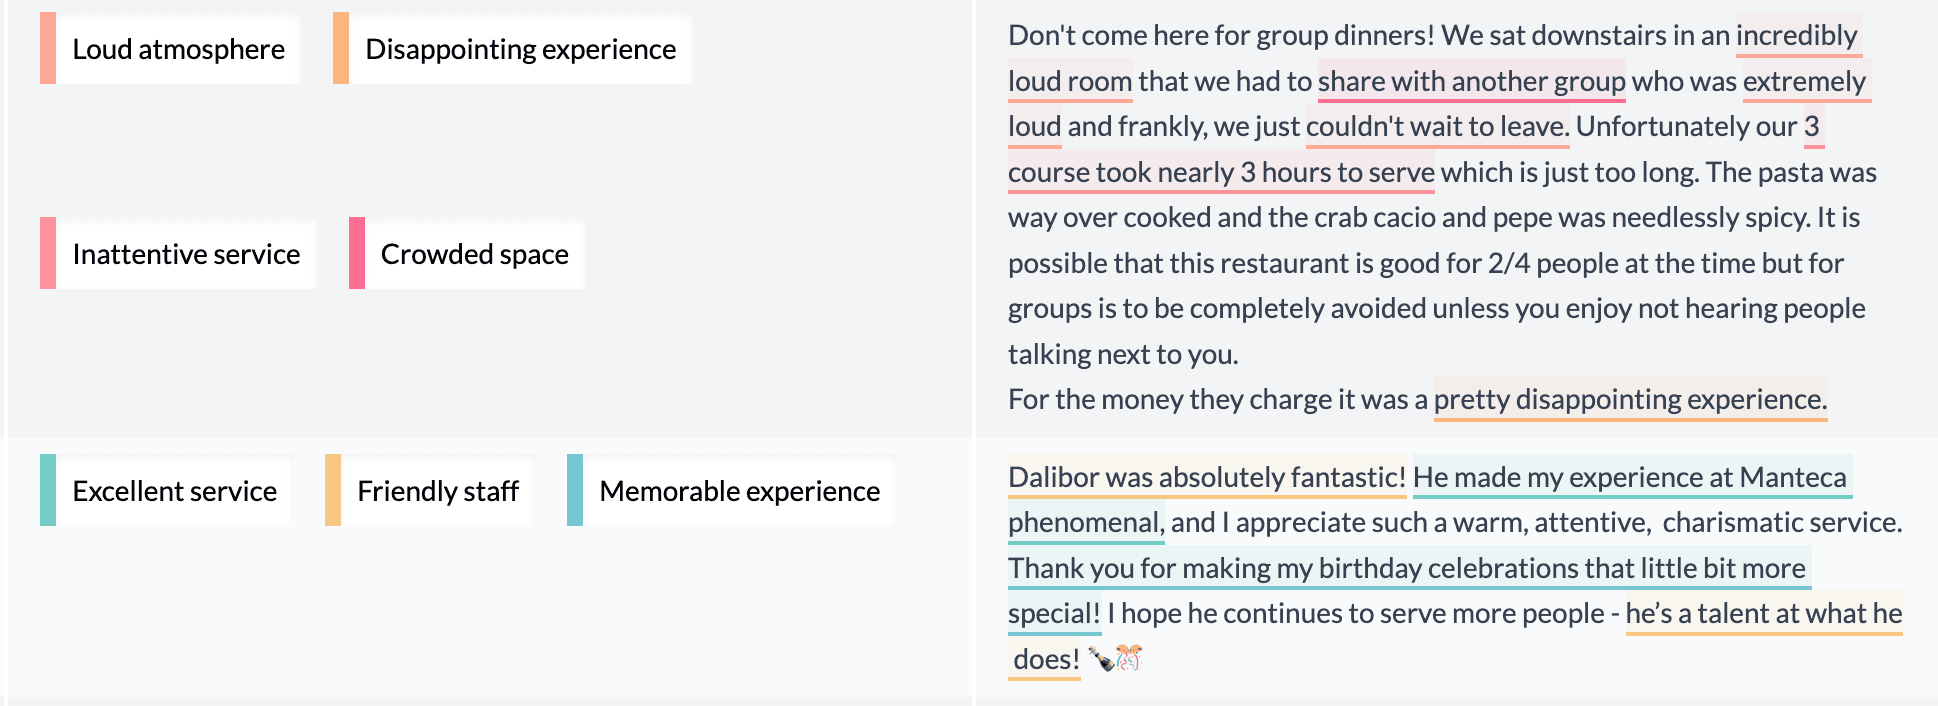
AI coding clusters themes, sentiment, and verbatims beside the quant results in the same project.
Text means manual coding, keyword syntax, or exporting to Python or another tool.
Share findings
Publish explorable dashboards and Insights Hubs, or export charts stakeholders can filter themselves.
Export static tables to Excel or PowerPoint. Stakeholders cannot explore without sending new requests.
See AddMaple in action
Real screens show how teams move from upload to cross-tabs, significance, text themes, and shareable outputs.
Feature matrix
A practical comparison for teams choosing a survey analysis workflow.
Support: Yes · Partial · No
SPSS .sav import
Yes — SAV plus CSV, Excel, and survey exports
Yes — Native SAV support
Instant dashboards on upload
Yes — Charts appear after automatic cleanup
No — Manual setup before visualization
Multi-select handling
Yes — Share-of-respondents by default
Partial — Requires recoding or Multiple Response sets
Live banner cross-tabs
Yes — Any column by any column, instantly
Partial — Menu-driven crosstabs per combination
Open-ended text analysis
Yes — AI coding, sentiment, summaries, Q&A
No — No built-in text clustering
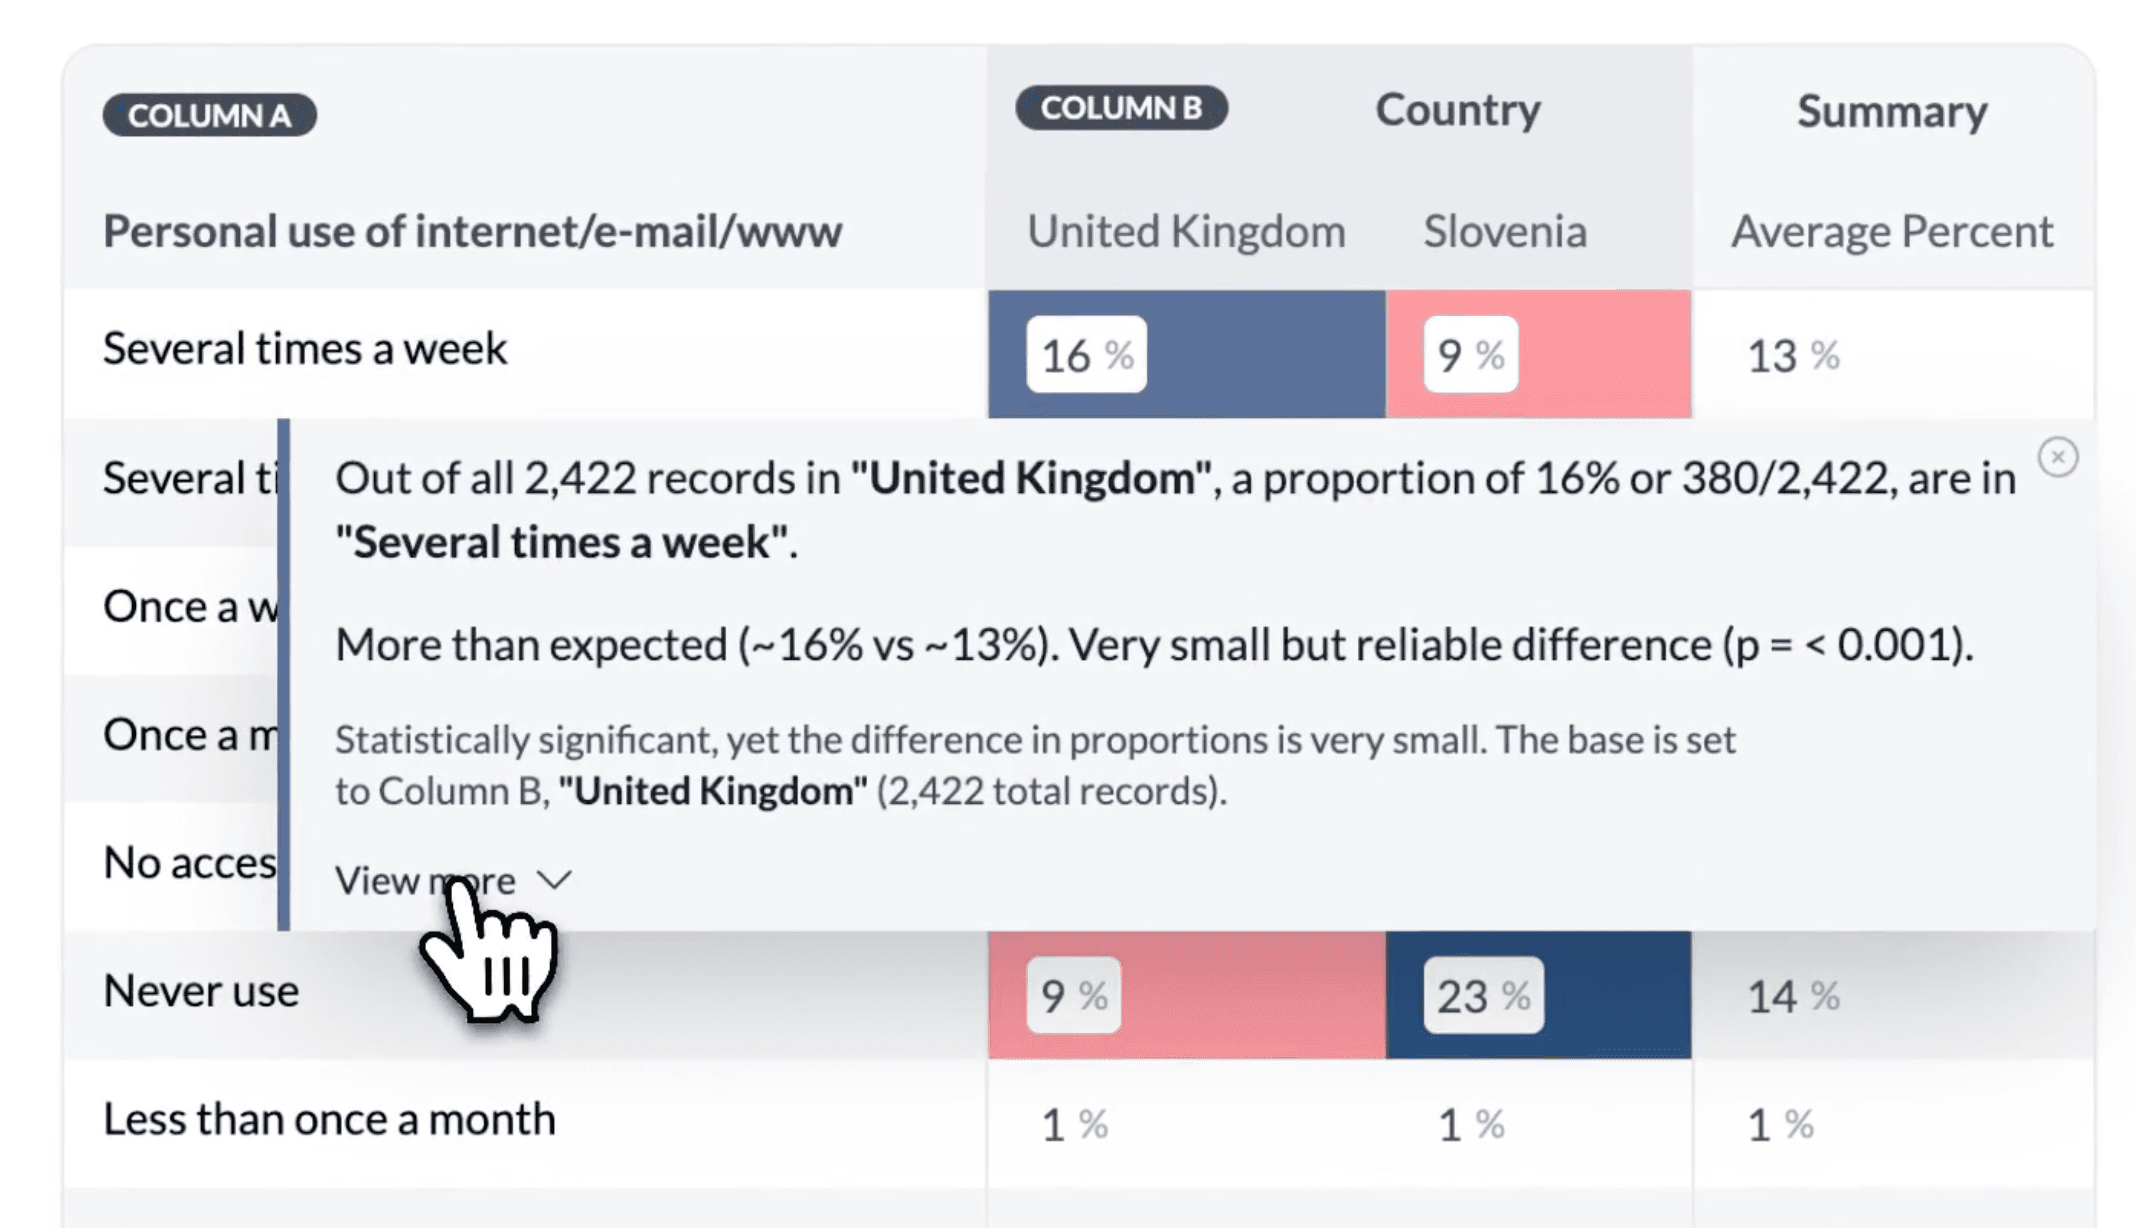
Significance and effect sizes
Yes — Color-coded cells with Cohen's h and Cramér's V
Partial — P-values available; effect size context is manual
Key driver and clustering workflows
Yes — Outputs become reusable segments
Partial — Possible with configured models and syntax rather than an automatic workflow
Shareable interactive dashboards
Yes — Insights Hubs and explorable dashboards
No — Static exports to other tools
Learning curve
Yes — Survey-native, minimal training
Partial — Powerful but syntax-heavy for many users
Advanced statistical modeling
Partial — Practical research stats, not SEM/factor analysis
Yes — Deep modeling and syntax automation
Try it on your data
Most agencies keep both: AddMaple for exploration, text, and client dashboards; SPSS when the brief needs factor analysis, SEM, or a syntax library you already maintain.
Save as SAV, CSV, or Excel. Variable labels carry over into AddMaple.
Check detected question types, grouped grids, multi-selects, and measures.
Build cross-tabs, test significance, code open ends, and create segments.
Publish an Insights Hub or export charts for the client deck.
FAQ
For everyday survey analysis — cross-tabs, multi-selects, significance, open ends, dashboards — yes. Keep SPSS for factor analysis, SEM, complex regression, or large recurring programs you already run via syntax.
Yes. Upload SAV directly or export CSV/Excel from SPSS. Variable names and value labels carry over.
You do not need them. AddMaple treats multi-select columns as multi-select on import and counts respondents per option by default — the logic MR sets exist to approximate in SPSS.
Filter once in AddMaple and every chart, cross-tab, and text summary updates. In SPSS that usually means revisiting crosstab dialogs, re-running tests, and re-exporting tables.
Yes. Use AddMaple for exploration, text coding, and dashboards. Export processed data or segments to SPSS when you need deeper modeling there.
Bring a real file and see how quickly AddMaple turns it into charts, pivots, text themes, and shareable findings.