

No reshape step for multi-selects
Comma-separated multi-select columns and Likert grids are understood on upload. You are not unpivoting in Prep or writing COUNTD LOD expressions per option.

When the dashboard is one survey file, not nine joined tables
Tableau is enterprise BI. AddMaple is for the Friday deadline on a single satisfaction export.
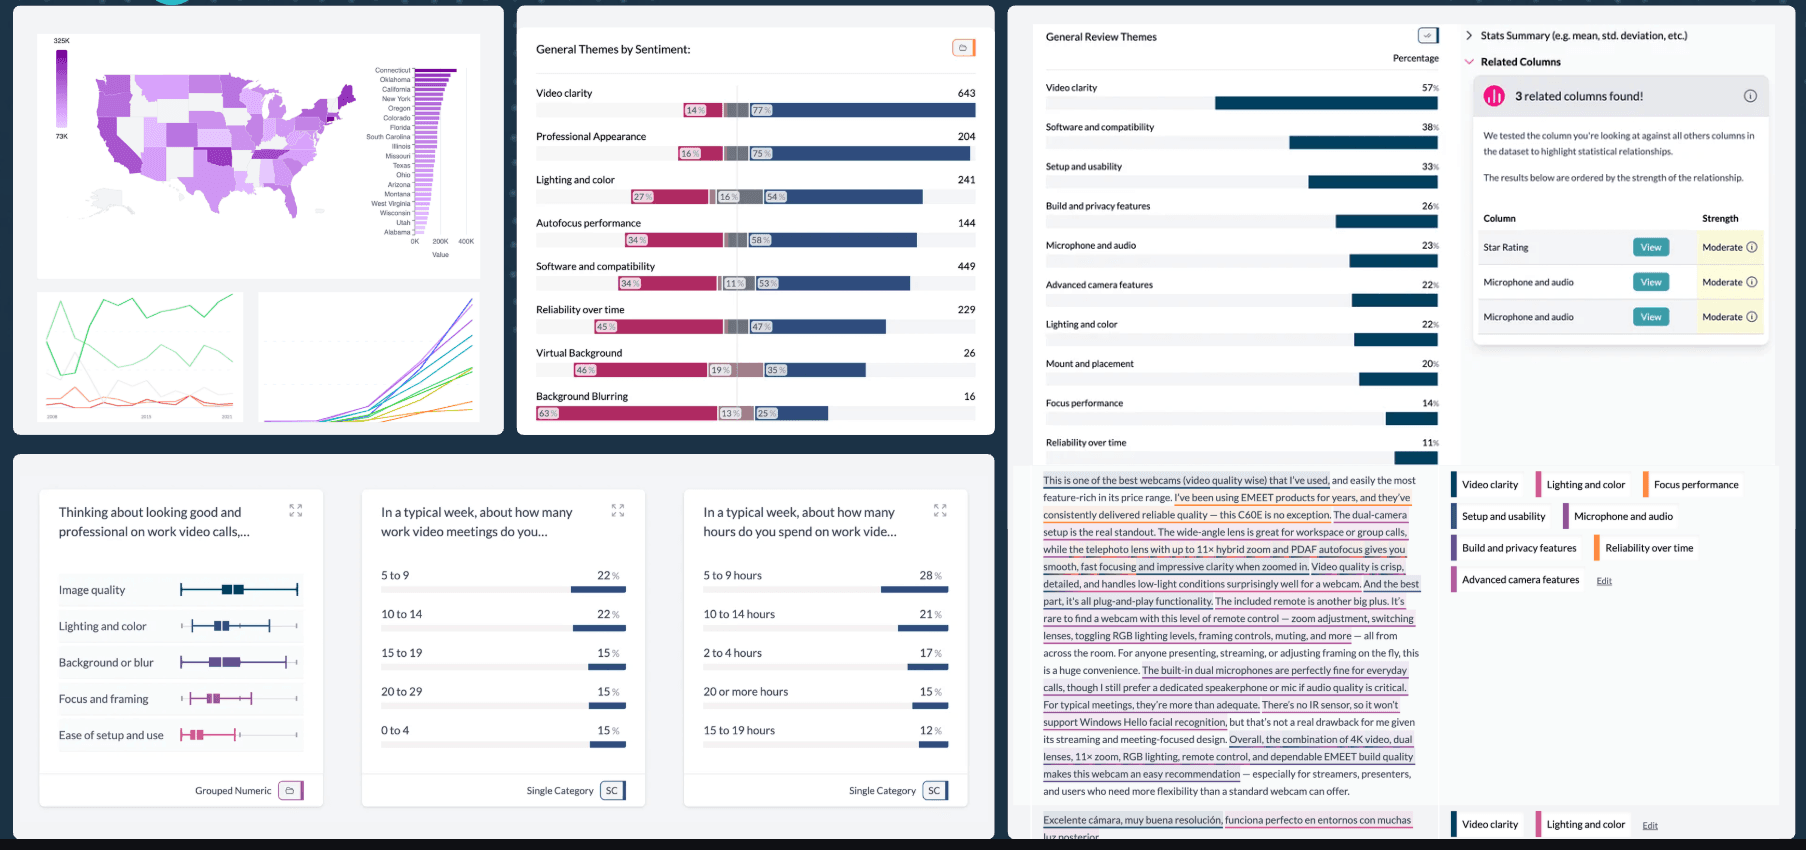
Tableau shines when you are joining warehouse, CRM, and finance data. Survey work is usually one CSV or SAV — and the pain is reshaping multi-selects, building calculated fields, and bolting on text analysis. AddMaple handles that structure on upload and ships interactive dashboards with significance built in.
Fast verdict
Tableau fits connected enterprise reporting and custom viz at scale. AddMaple fits a single survey file that needs segment cuts, text themes, and a shareable dashboard on a short timeline.
AddMaple advantage
Tableau can build survey dashboards — but the first day is often data prep and calculated fields, not answers.
Comma-separated multi-select columns and Likert grids are understood on upload. You are not unpivoting in Prep or writing COUNTD LOD expressions per option.
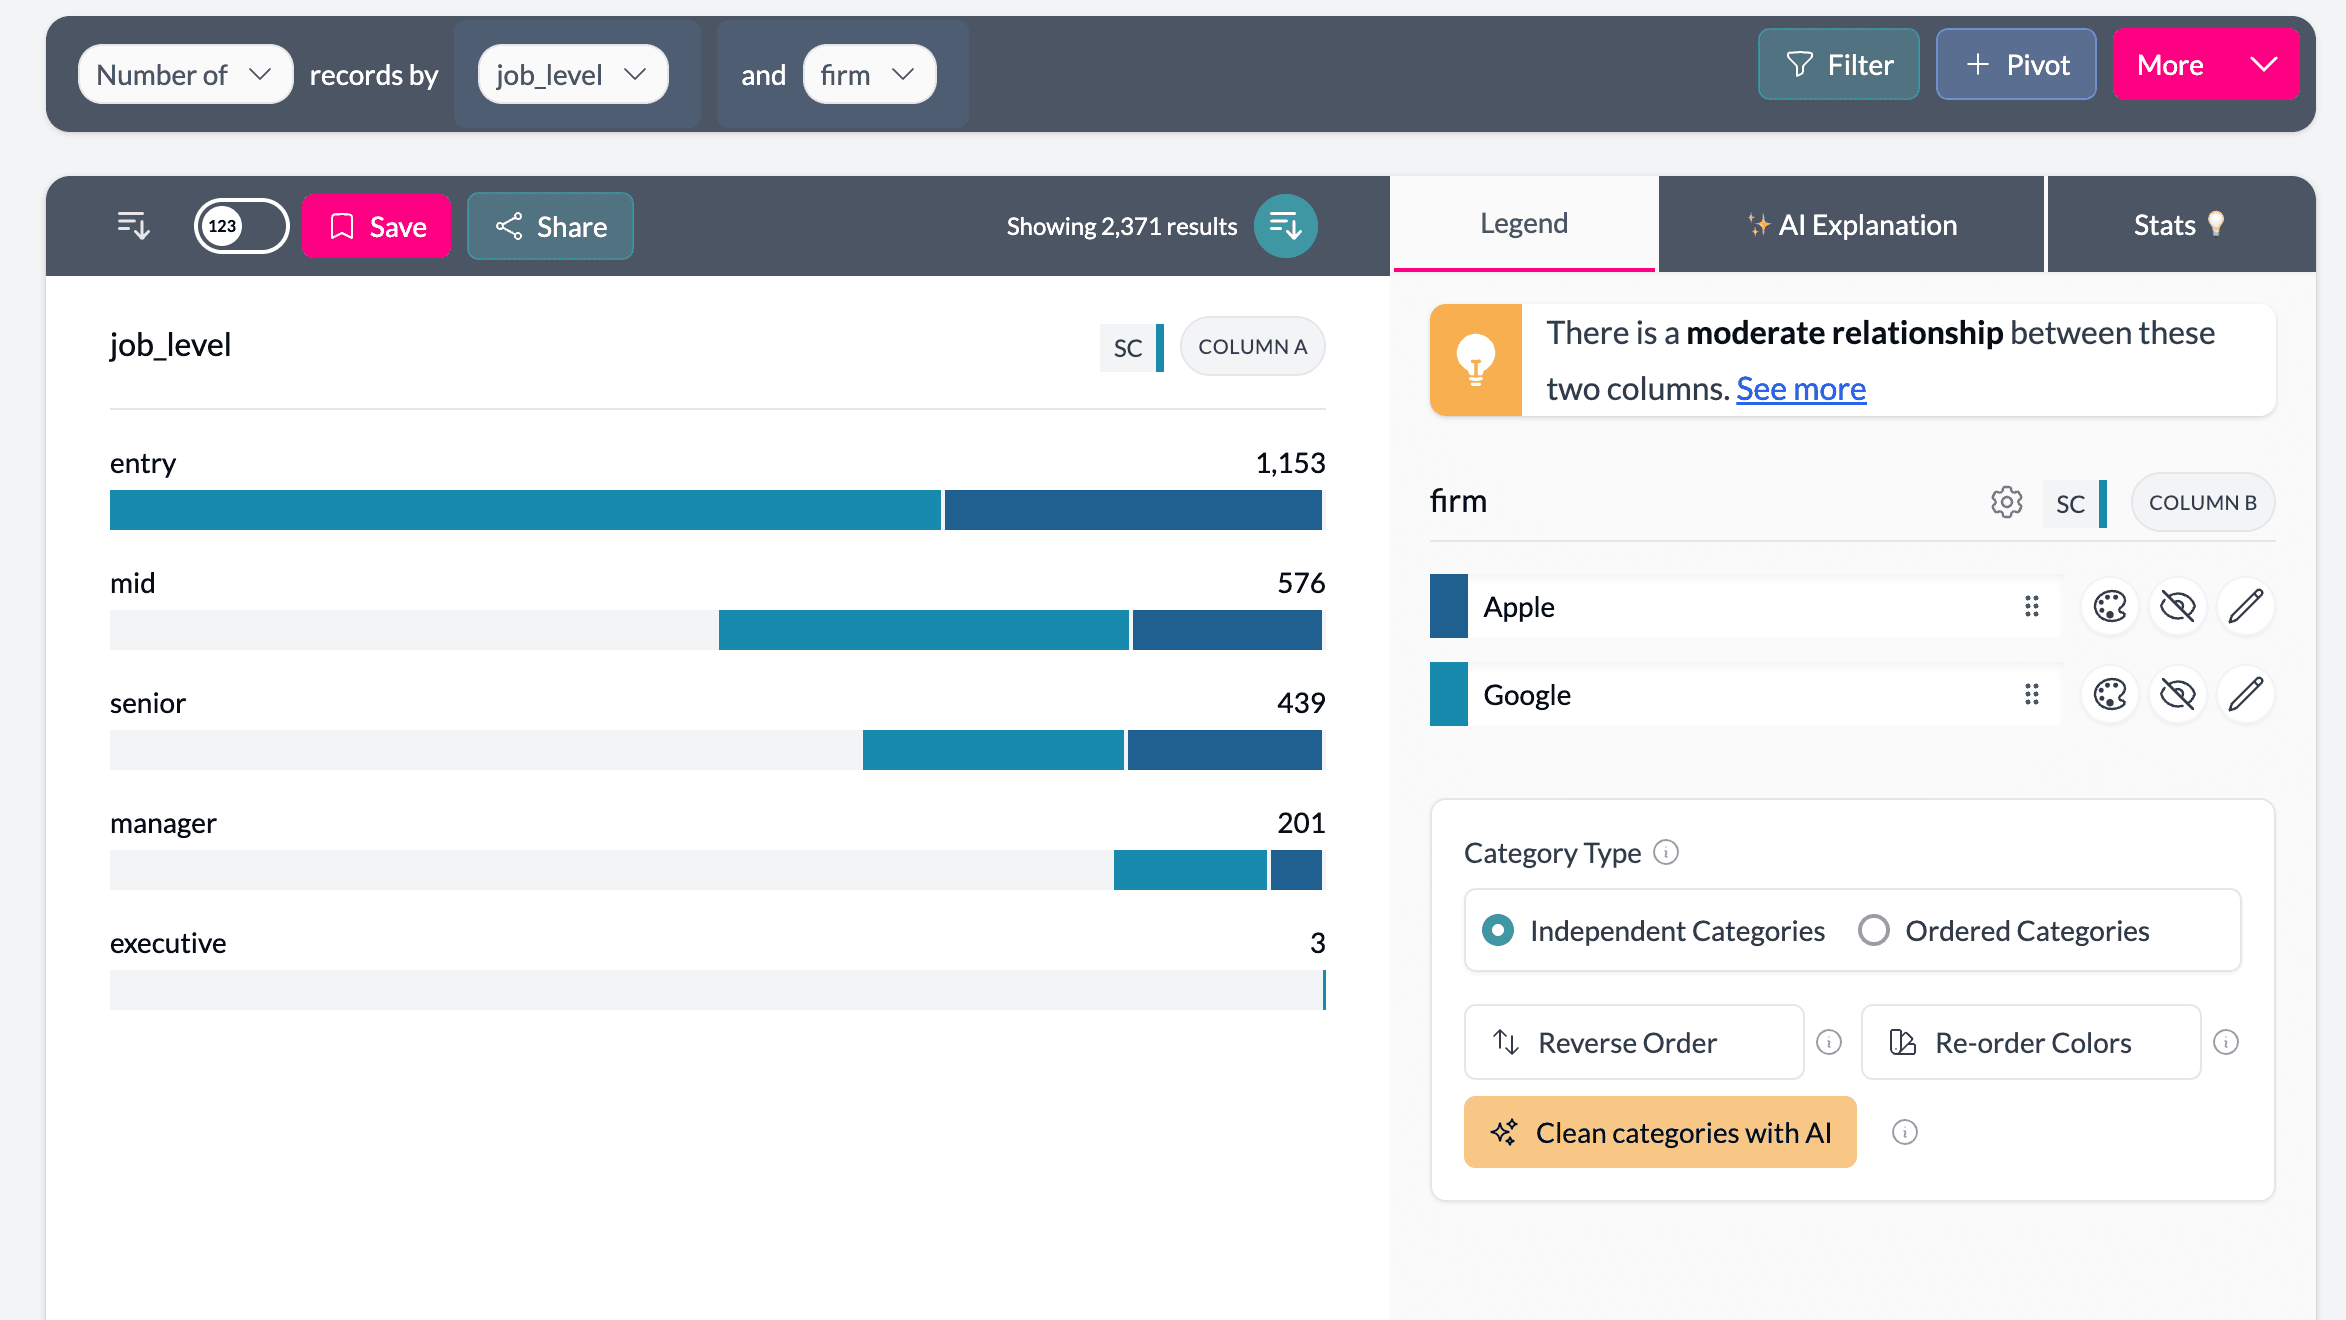
Pivot satisfaction by region, tenure, or product in clicks. Filters propagate across every chart without configuring each sheet's aggregations.
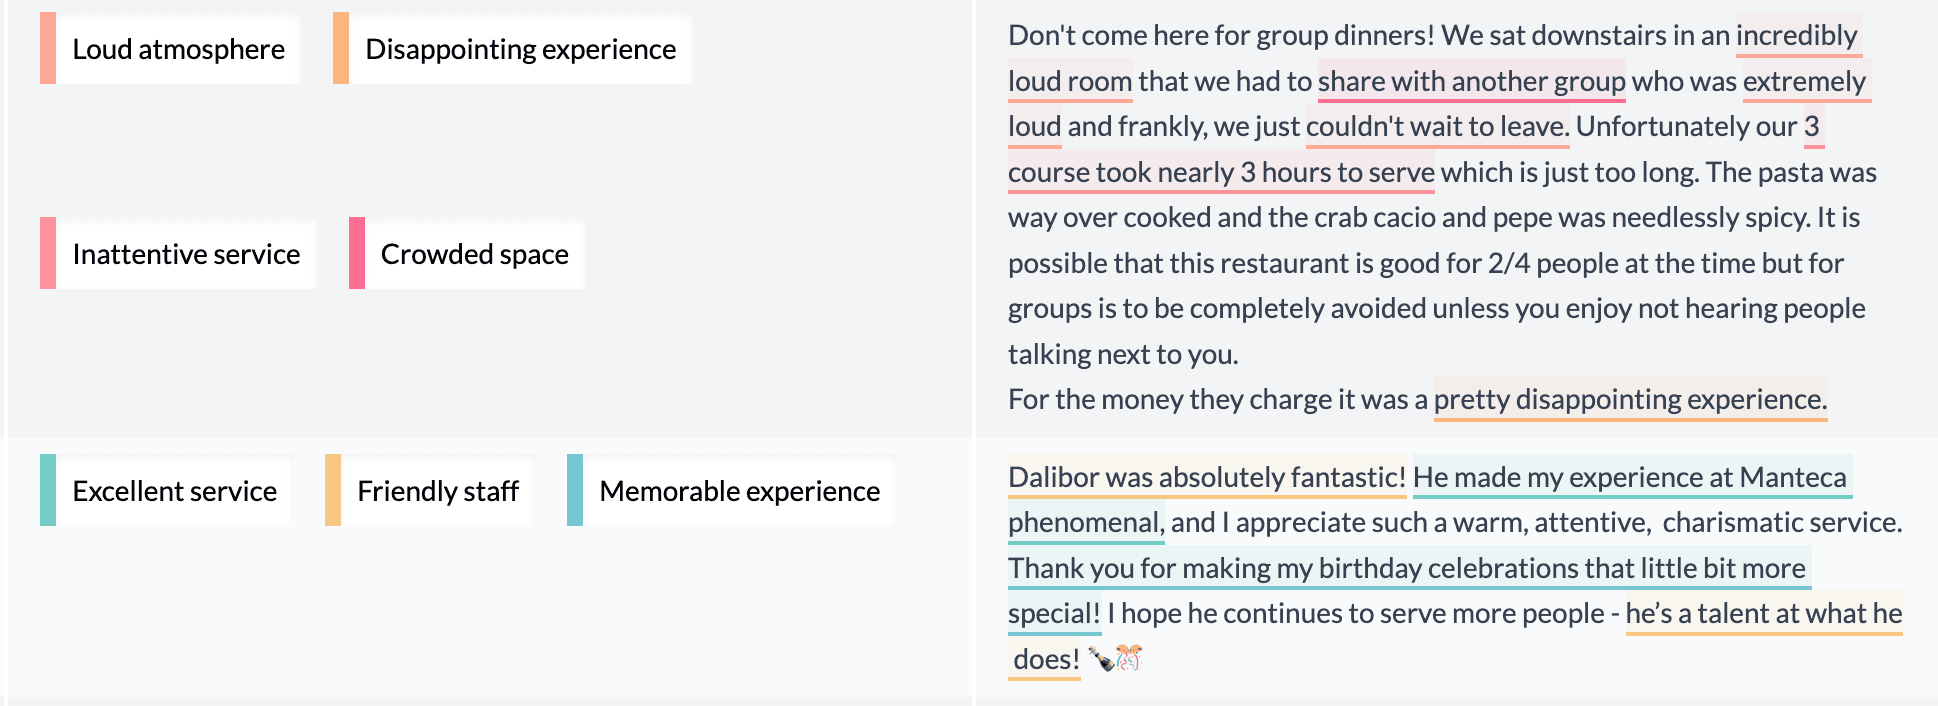
AI coding clusters open ends with quotes, then lets you pivot those themes by NPS or segment — no round trip through an external text tool.
Workflow comparison
A 600-response customer satisfaction survey needs segment cuts, feature adoption, text themes, and significance — due Friday.
Prepare data
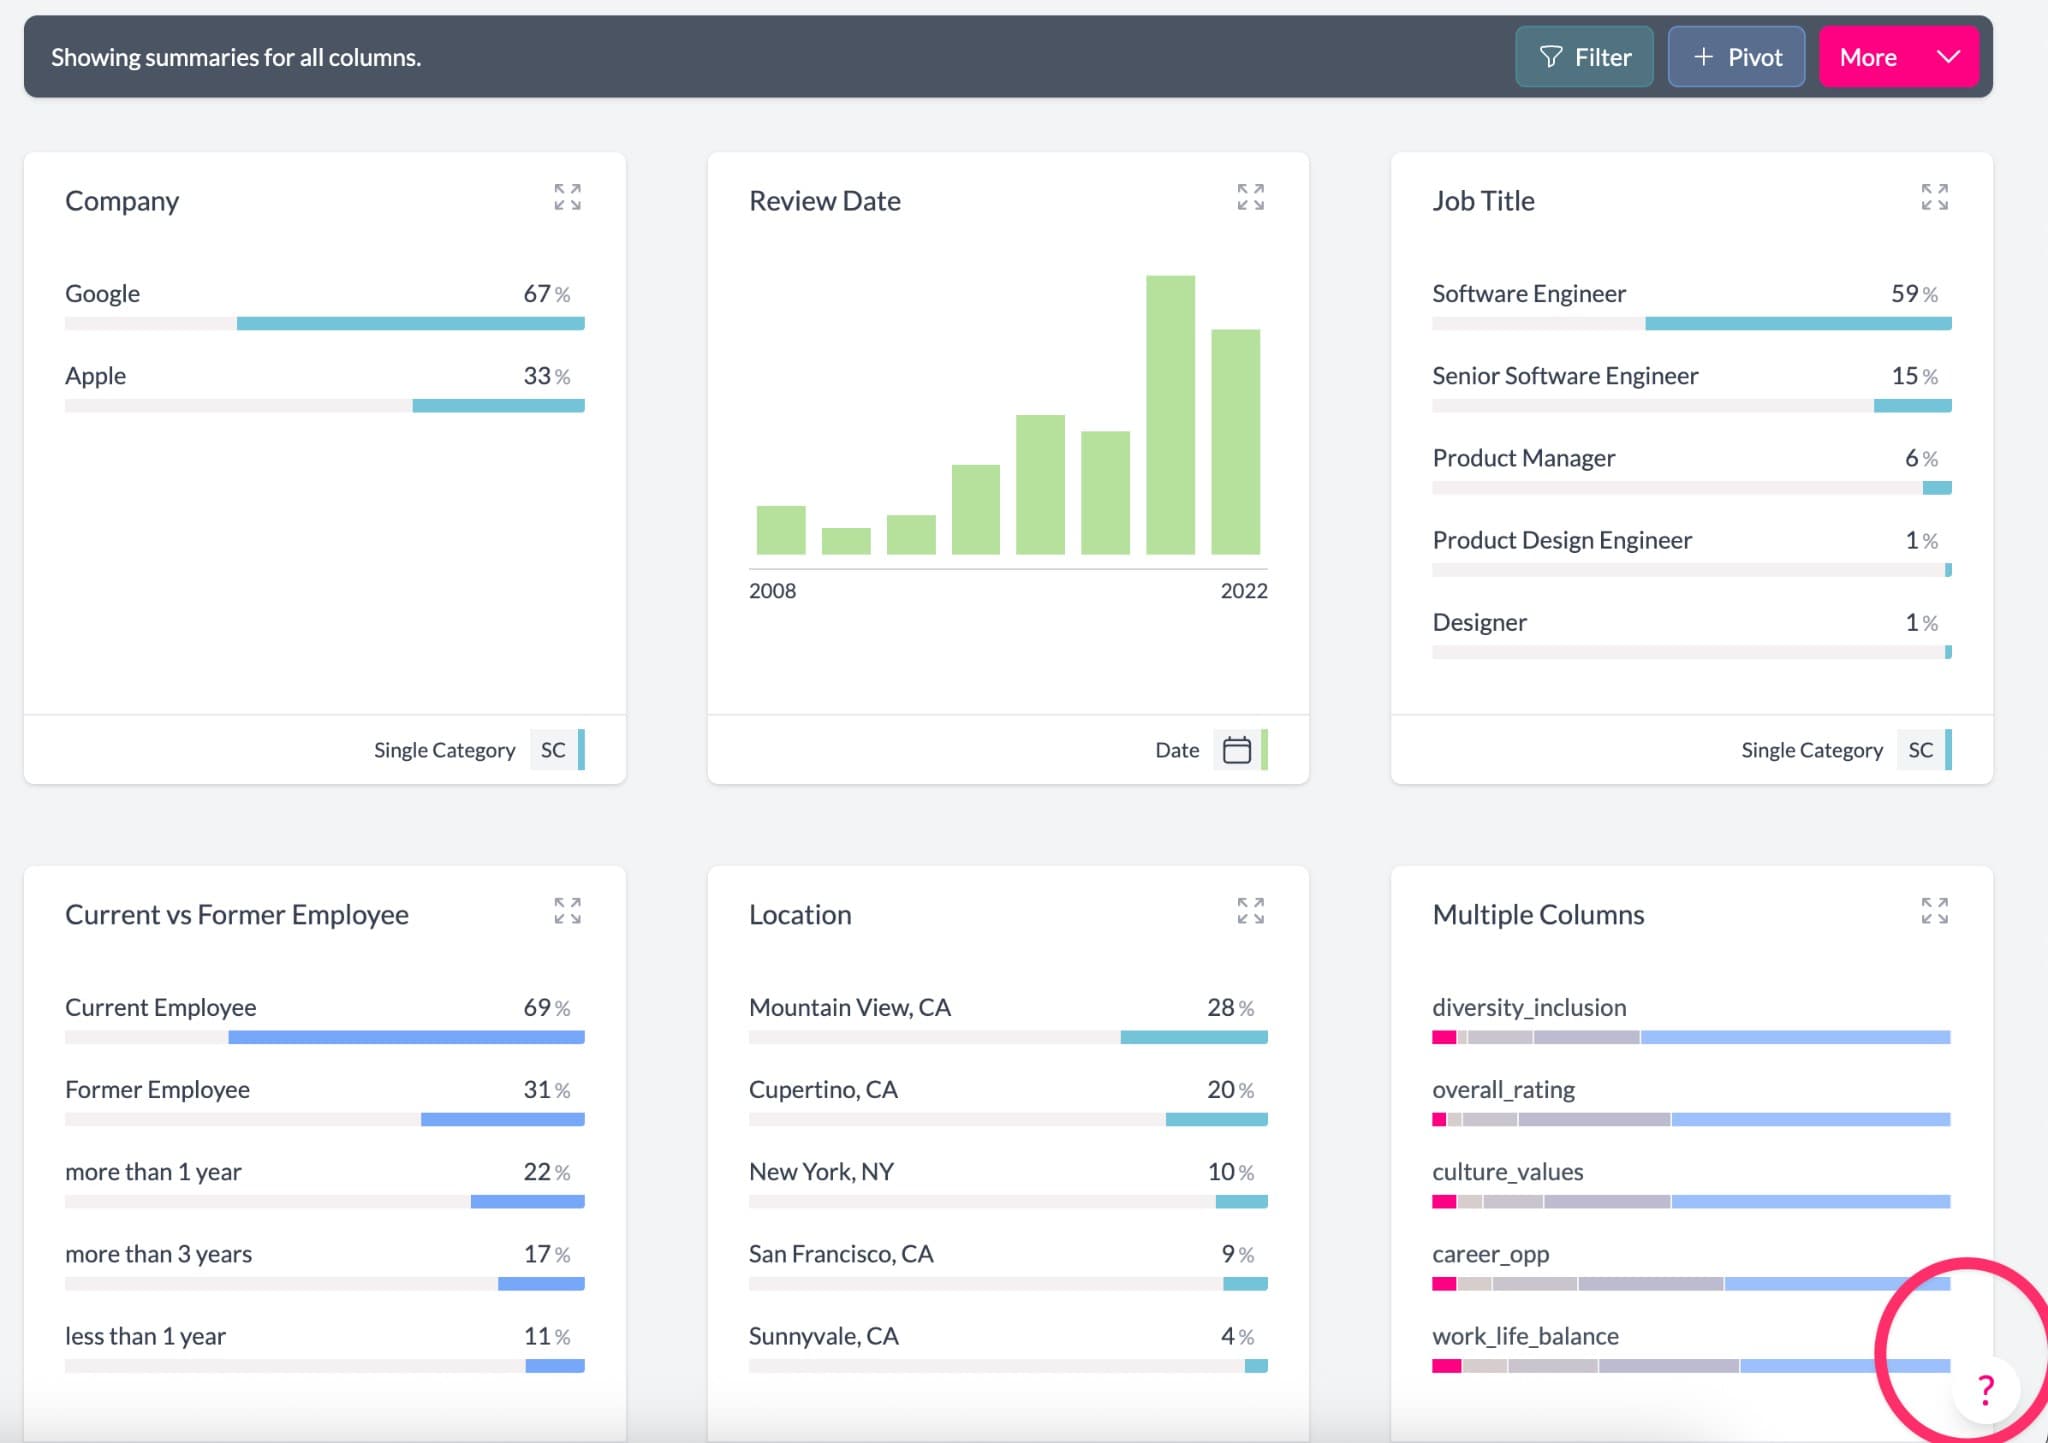
Upload CSV or SAV. AddMaple detects question types and cleans labels, grids, and multi-selects automatically.
Unpivot comma-separated multi-selects, define dimensions and measures, then build calculated fields before the first sheet.
Build core charts
Pivot satisfaction by region, product, and tenure in clicks. Filters update every chart instantly.
Configure dimensions, measures, aggregations, and color for each sheet individually.
Handle multi-select
Share-of-respondents logic is built in. No unpivoting or fragile calculated fields.
LOD expressions, separate calculated fields per option, or a Prep workflow to get respondent-level counts right.
Analyze open ends
AI coding clusters themes with quotes, then cross them against NPS and segments in one project.
Export to a text tool, re-import themes as columns, rebuild affected sheets.
Share with stakeholders
Publish a secure read-only link. No viewer licenses or server infrastructure required.
Tableau Server or Cloud with licensing and permissions setup for client-safe sharing.
See AddMaple in action
Audience Audit moved client-facing survey dashboards from Tableau to AddMaple when exploration and text themes mattered more than custom enterprise viz.

Feature matrix
A practical comparison for teams building survey dashboards.
Support: Yes · Partial · No
Survey file upload
Yes — SAV, CSV, Excel, and platform exports
Partial — Usually requires prep and reshaping first
Time to first dashboard
Yes — Minutes after upload
Partial — Often hours or days of setup
Multi-select handling
Yes — Share-of-respondents by default
Partial — Calculated fields or data reshaping
Likert scale support
Yes — Auto-grouped grids and neutral-aligned charts
Partial — Custom hierarchy setup
Open-ended text analysis
Yes — AI coding, sentiment, summaries
No — Requires external tools or add-ons
Statistical significance
Yes — Built into cross-tab cells
No — Requires R/Python scripts and re-import
Interactive filtering
Yes — Click-to-filter across all charts
Partial — Strong after dashboard build; survey cuts need more setup
Client-safe sharing
Yes — Password-protected read-only links
Partial — Server/Cloud licenses and permissions
Enterprise data pipelines
Partial — Optimized for survey projects
Yes — Connects to warehouses, APIs, and SQL
Custom visualizations
Partial — Survey-focused chart types
Yes — Extensive customization options
Try it on your data
Export the survey CSV behind your Tableau workbook and rebuild the core cuts — most teams report 30–60 minutes with text and significance included.
Use CSV or SAV from your survey platform or Tableau data source.
Confirm detected question types, multi-selects, and Likert grids.
Recreate satisfaction, NPS, feature adoption, and text themes with built-in tools.
Share a read-only link with your stakeholders — no licenses required.
FAQ
Yes. Many teams use AddMaple for survey-specific dashboards and fast exploration, then feed summary metrics into broader Tableau roll-ups that combine CRM, finance, or warehouse data.
For a typical satisfaction dashboard — segment cuts, multi-select adoption, text themes, significance — most teams finish in 30–60 minutes because AddMaple skips the reshape and calculated-field work.
No. AddMaple publishes password-protected read-only links. Tableau client sharing usually means Server or Cloud licensing and permissions setup.
When the dashboard must join survey results with warehouse or CRM pipelines, embed in a broader BI portal, or use highly custom visualizations your org already standardizes on in Tableau.
Bring the CSV or SAV behind your workbook. Rebuild satisfaction, NPS, feature adoption, and text themes with less prep and no viewer licenses.