

Exploration before report design
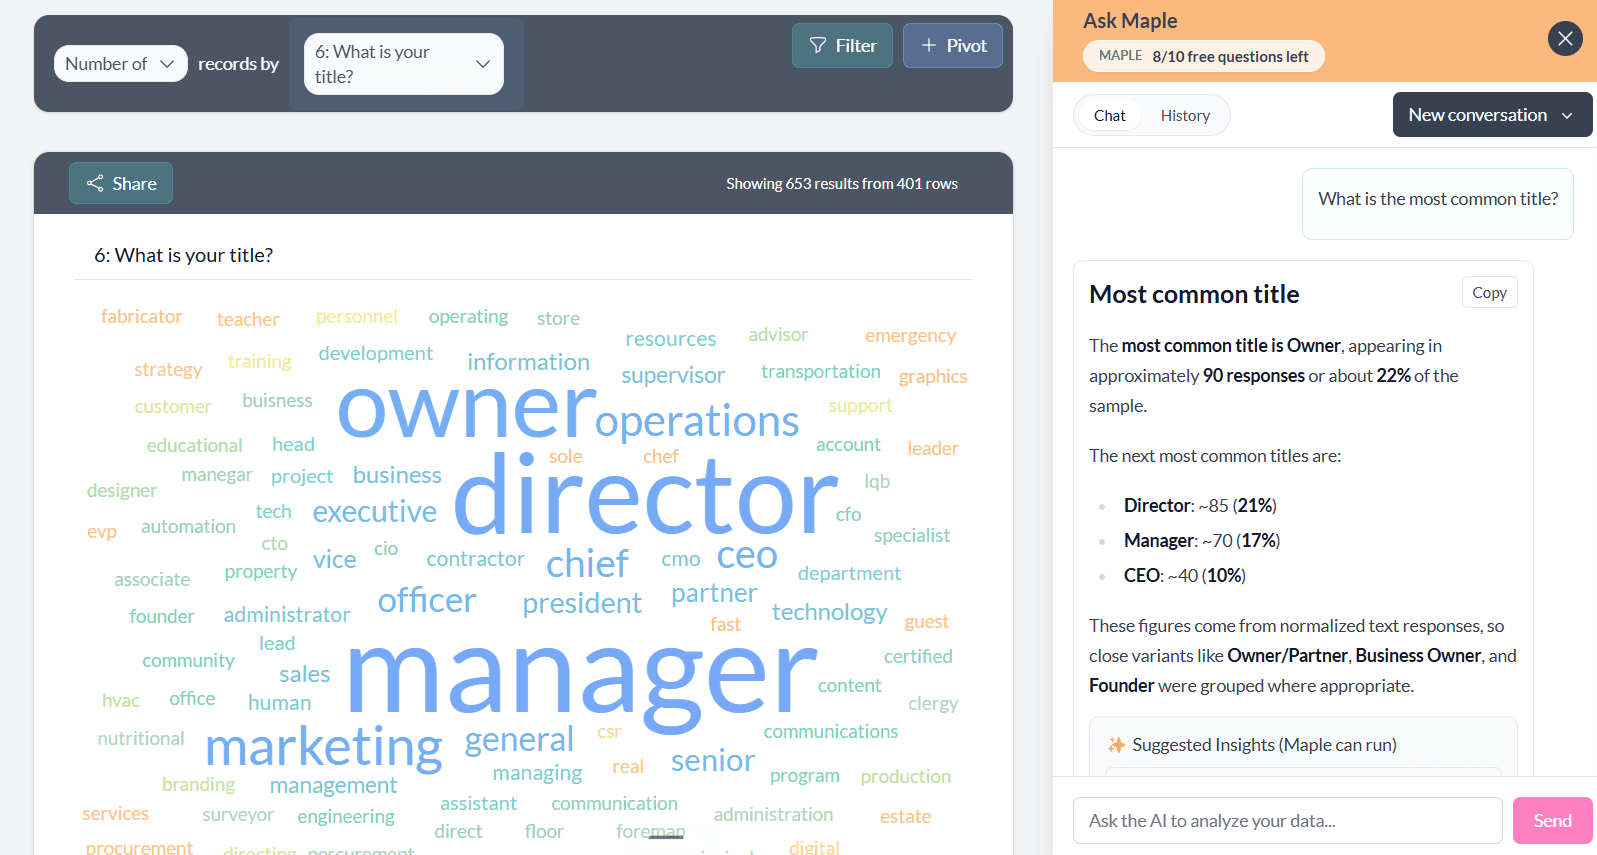
Upload SAV or platform exports and start pivoting immediately. You are not laying out pages or wiring R outputs before you know what the data says.

For teams who want analysis, not another reporting build
DisplayR is a serious technical reporting environment. AddMaple is built for teams who want to explore, explain, and share survey data without scripting every chart or relying on one platform expert.
If you are comparing DisplayR alternatives, you probably like its depth but not the setup tax — document structure, R-backed customization, and cloud latency on big files. We also hear from teams whose DisplayR expert leaves and whose reporting setup becomes hard to operate. AddMaple gives the wider team instant cleaning, live cross-tabs, open-ended coding, key drivers, and shareable dashboards in one browser-based workspace.
Fast verdict
DisplayR fits teams that invest in R-backed reporting and automated deck production. AddMaple fits teams that need to move from upload to cross-tabs, text themes, and client exploration without building the environment first.
AddMaple advantage
DisplayR rewards teams that build repeatable reporting systems. AddMaple rewards teams that need answers while the brief is still moving.
Upload SAV or platform exports and start pivoting immediately. You are not laying out pages or wiring R outputs before you know what the data says.
Question types, Likert grids, multi-selects, and labels are detected on import. Researchers can update, hand over, and reuse a project without waiting for the one person who knows the R-backed reporting setup.
Related columns, mixed-type clustering, and key-driver results become segments and calculated columns you reuse across charts, tables, and dashboards.
Workflow comparison
A tracker debrief with banner tables, open ends, significance, and a client-facing dashboard — compare what each tool asks you to build first.
Upload and clean
Upload SAV, CSV, Excel, or survey-platform exports. AddMaple detects question types, cleans labels, groups grids, and prepares charts automatically.
Strong survey data support, but projects often require more setup, configuration, or specialist ownership.
Explore quant data
Instant charts, filters, pivots, banner cross-tabs, related columns, and significance testing stay available as you ask new questions.
Powerful analysis environment with deep customization, especially for teams comfortable with its reporting model.
Analyze open ends
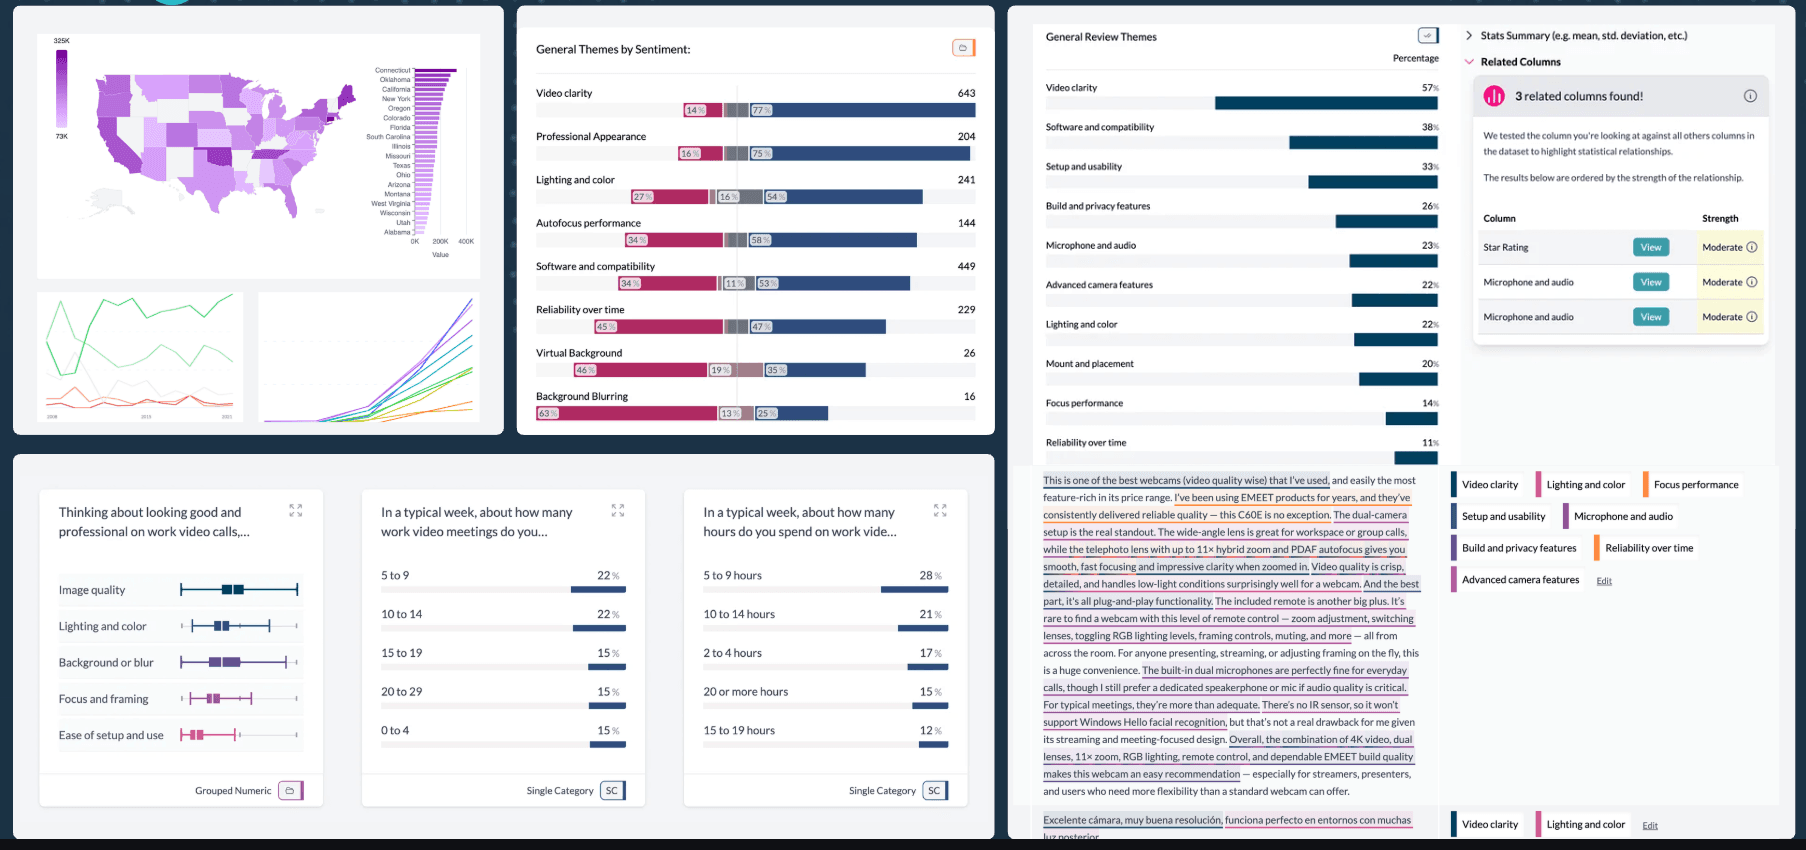
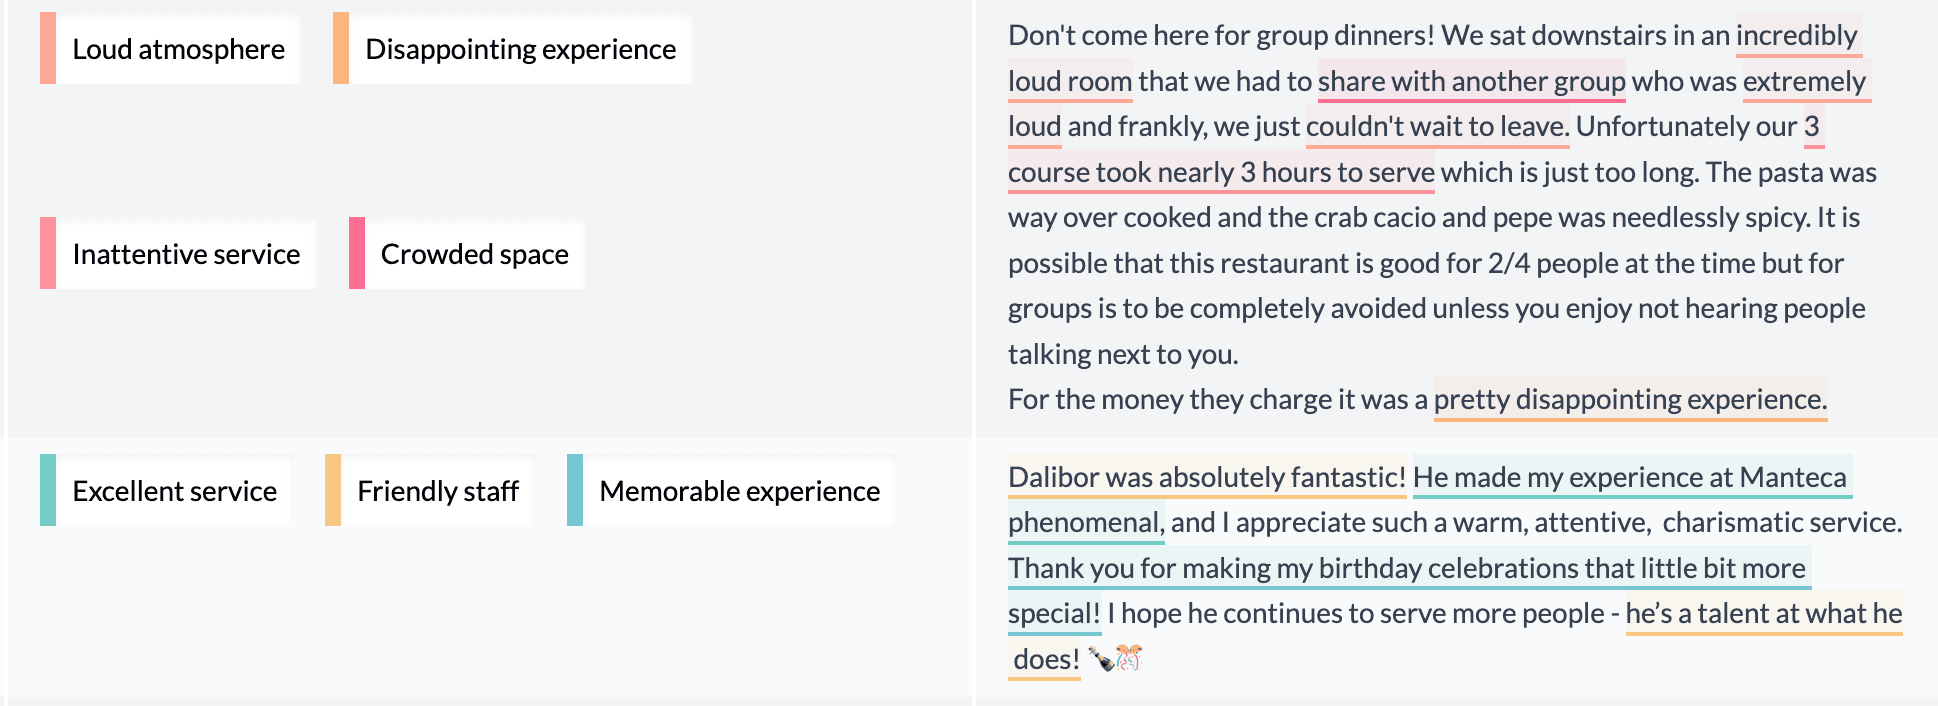
Theme coding, sentiment, summaries, and verbatim exploration sit beside the charts and filters.
Can support text workflows, but they often sit outside the core quant reporting flow teams use daily.
Use advanced stats
Run key drivers, related-column discovery, and mixed-type clustering, then reuse the outputs as segments and filters.
Very capable for advanced statistical work, especially when teams already use R-backed workflows.
Share findings
Publish dashboards and Insights Hubs, export charts, and keep the project explorable for stakeholders.
Strong for polished reporting workflows, with more setup when stakeholders need lightweight exploration.
See AddMaple in action
Real AddMaple screens show the difference: fast exploration, AI assistance beside the data, connected qual analysis, dashboards, and stakeholder-ready outputs.

Feature matrix
A side-by-side breakdown of what really matters
Support: Yes · Partial · No
Instant dashboards
Yes — Auto-created on upload
Partial — Manual setup or scripting
AI text analysis
Yes — Built-in, no config
Partial — Requires OpenAI API
Smart chart explanations
Yes — AI explains what you're seeing
No — None
Statistical insights
Yes — Auto-surfaced, plain-language output
Yes — Full testing suite
Custom dashboards
Yes — Drag-and-drop, templatable, link shareable
Partial — Advanced, but often needs R scripting and report setup
Data privacy
Yes — Local (browser-based)
Partial — All analysis in the cloud
Performance
Yes — In-browser, instant filters/pivots
Partial — Slower with large files
Usability
Yes — Intuitive, no training needed
Partial — Learning curve for new users
Collaboration
Yes — Easy link sharing, export to Notion/Slack
Yes — Real-time co-editing
Pricing
Yes — Designed for fast team adoption
Partial — Can require more specialist ownership
Try it on your data
The clearest test is to bring one messy survey file and see how quickly your team reaches a useful finding.
Start with SAV, CSV, Excel, or an export from your survey platform.
Review detected question types, grouped grids, multi-selects, labels, and measures.
Run cross-tabs, related columns, clusters, key drivers, and open-ended themes.
Publish an explorable dashboard, create an Insights Hub, or export the charts you need.
FAQ
Yes, if your priority is faster exploration, text coding beside quant cuts, and shareable dashboards without R scripting or heavy report setup. DisplayR remains stronger when you rely on deep R customization, MaxDiff/conjoint, or automated PowerPoint production at scale.
Not entirely. DisplayR is built around R-backed customization and technical reporting. AddMaple covers everyday survey analysis — cross-tabs, significance, key drivers, open-ended coding, and dashboards — without requiring R expertise.
That is a common reason teams evaluate AddMaple. Projects are designed for everyday researchers to open, update, filter, extend, and hand over, so analysis does not pause while a new DisplayR or R specialist is hired.
AddMaple processes data in the browser, which keeps filters and pivots responsive on many large files (up to roughly 500MB) without waiting on cloud round-trips. DisplayR's cloud model can feel slower on heavy filters or big uploads.
Yes. Theme coding, sentiment, summaries, and verbatim exploration sit in the same project as your charts and cross-tabs — useful when a debrief needs both the numbers and the why behind them.
Bring a project with cross-tabs, open ends, or a tight turnaround. See how quickly your team gets from upload to something you would actually send a client.