

Exploration without re-running the pipeline
Pivot any column, test a new segment, or follow up on an unexpected cell without configuring another Fusion analysis pass.

When the question changes after the analysis run
Fusion automates planned quant runs from SPSS files. AddMaple keeps the same survey file explorable while you pivot, code open ends, and share live dashboards.
Citrus Fusion is built for teams who want AI-guided statistical runs and PowerPoint-ready output from a clean .sav upload. AddMaple fits when the brief still shifts — you need banner cross-tabs on the fly, qual beside quant, or a client hub they can filter themselves, not just a finished deck.
Fast verdict
Fusion is strong when you know the analysis plan upfront and want transparent, automated quant output into slides. AddMaple is stronger when researchers still need to interrogate, segment, explain, and re-cut the data after the first pass.
AddMaple advantage
Fusion optimizes for the moment you press go on a statistical plan. AddMaple optimizes for everything that happens before and after that moment.
Pivot any column, test a new segment, or follow up on an unexpected cell without configuring another Fusion analysis pass.
SAV, CSV, Excel, and Qualtrics or Typeform exports all land in one project with grouped grids, cleaned labels, and multi-select logic handled on import.
Code open ends, summarize verbatims, and cross themes against NPS or segments — work Fusion is not primarily built around.
Workflow comparison
Same 400-response concept test: one team wants an automated driver analysis into PowerPoint; the other needs to keep cutting by segment and coding verbatims through the week.
Prepare data
Upload SAV, CSV, Excel, or platform exports. AddMaple detects question types, groups grids, cleans labels, and prepares dashboards.
Fusion is positioned around uploading respondent-level survey data, especially SPSS .sav files.
Explore results
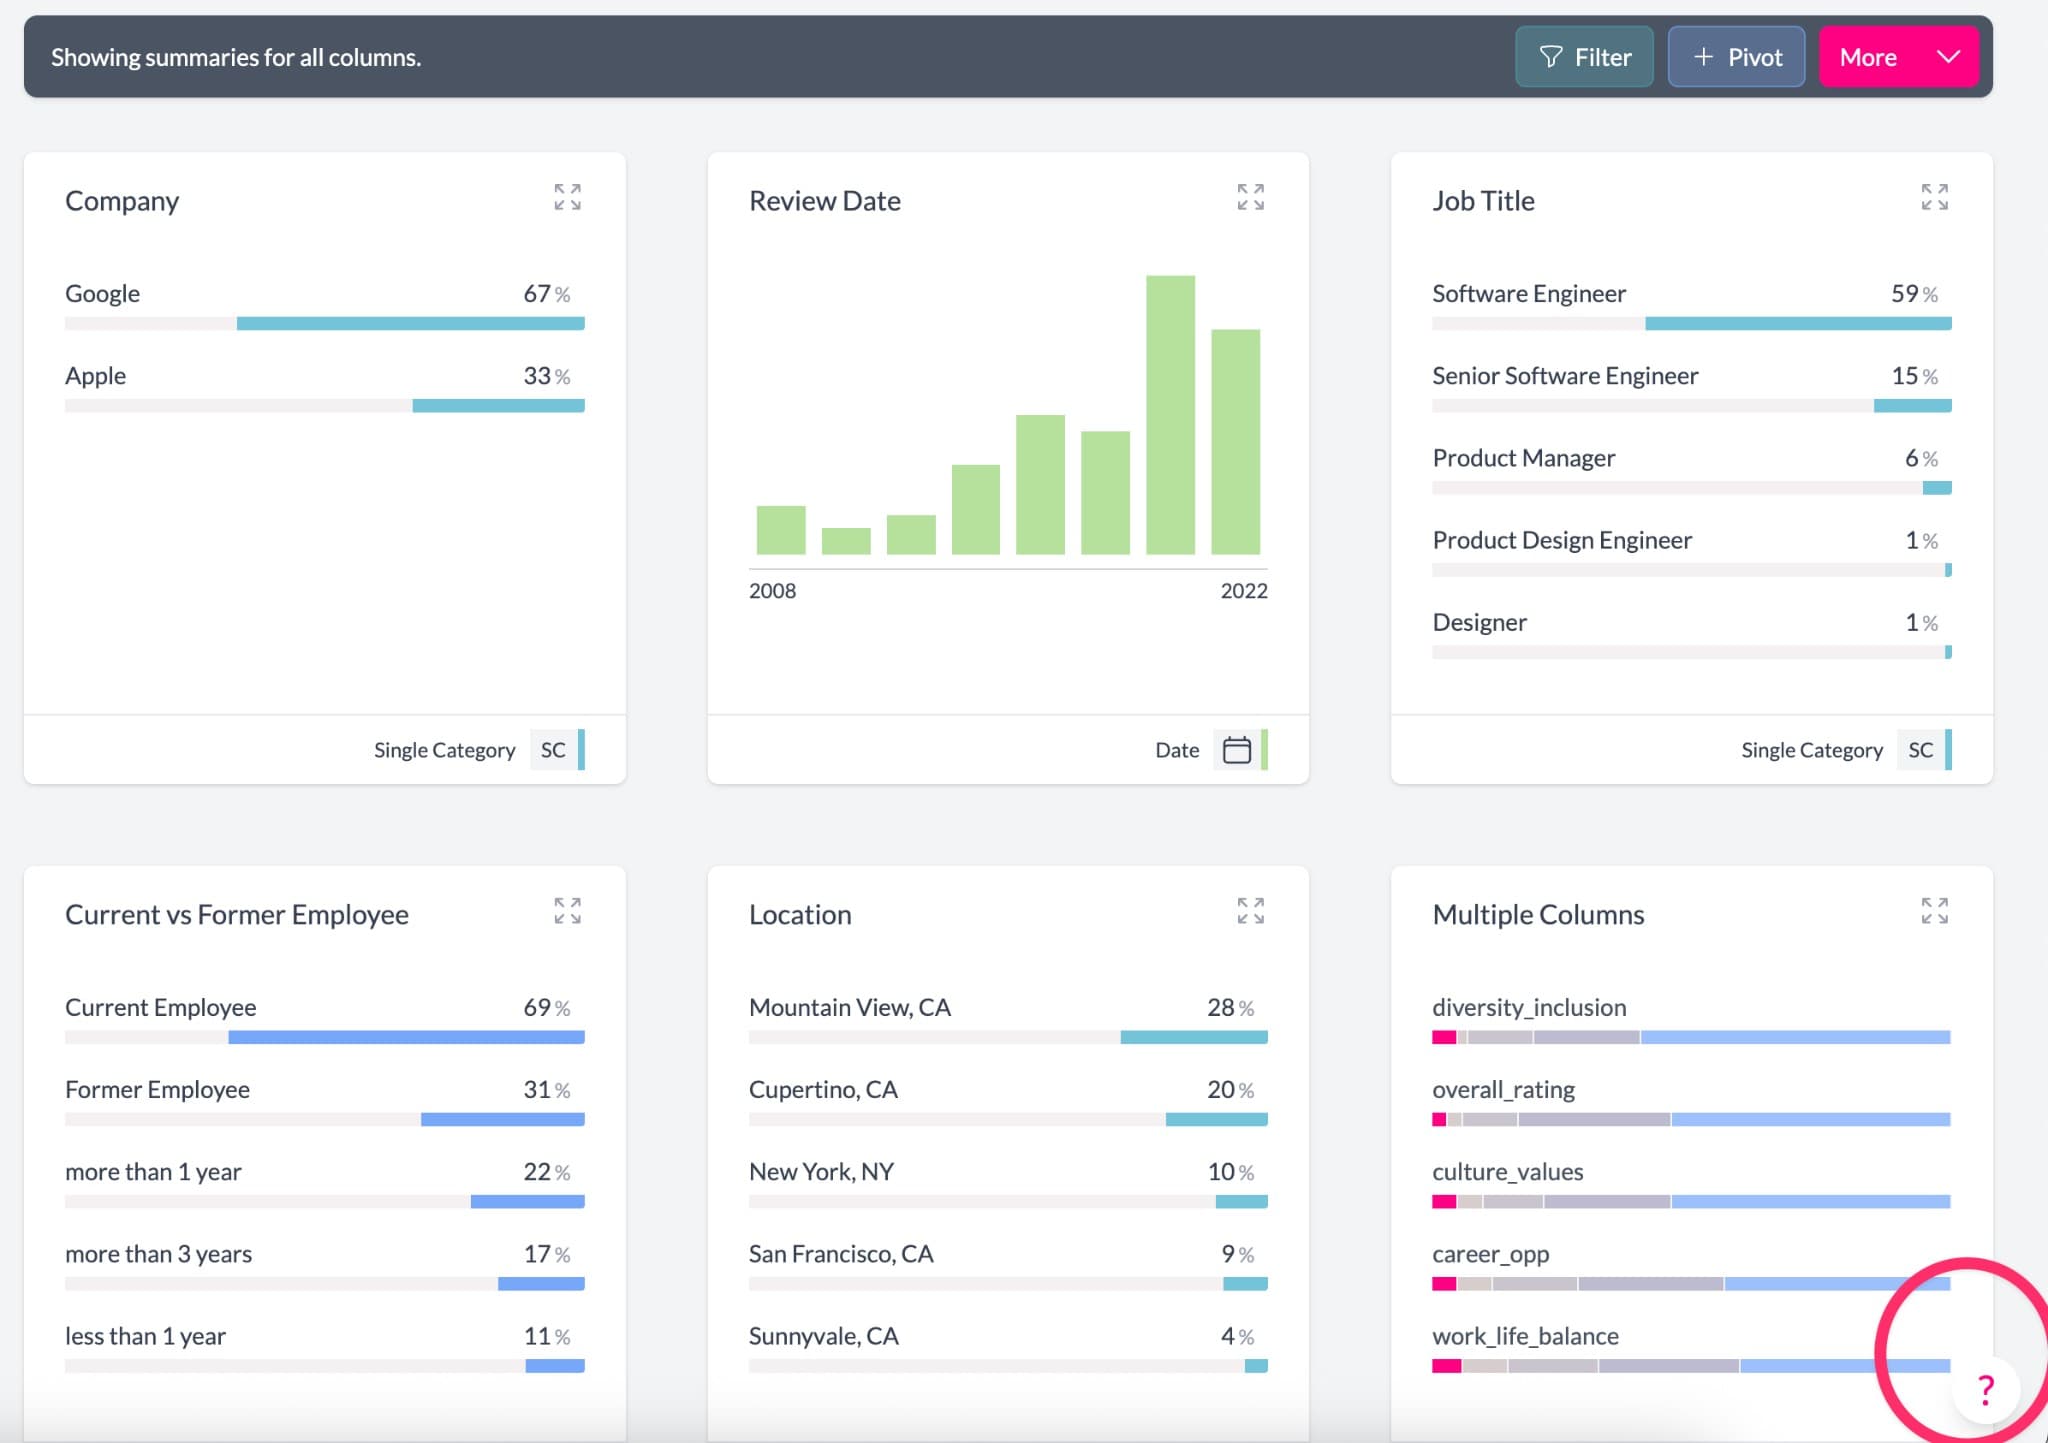
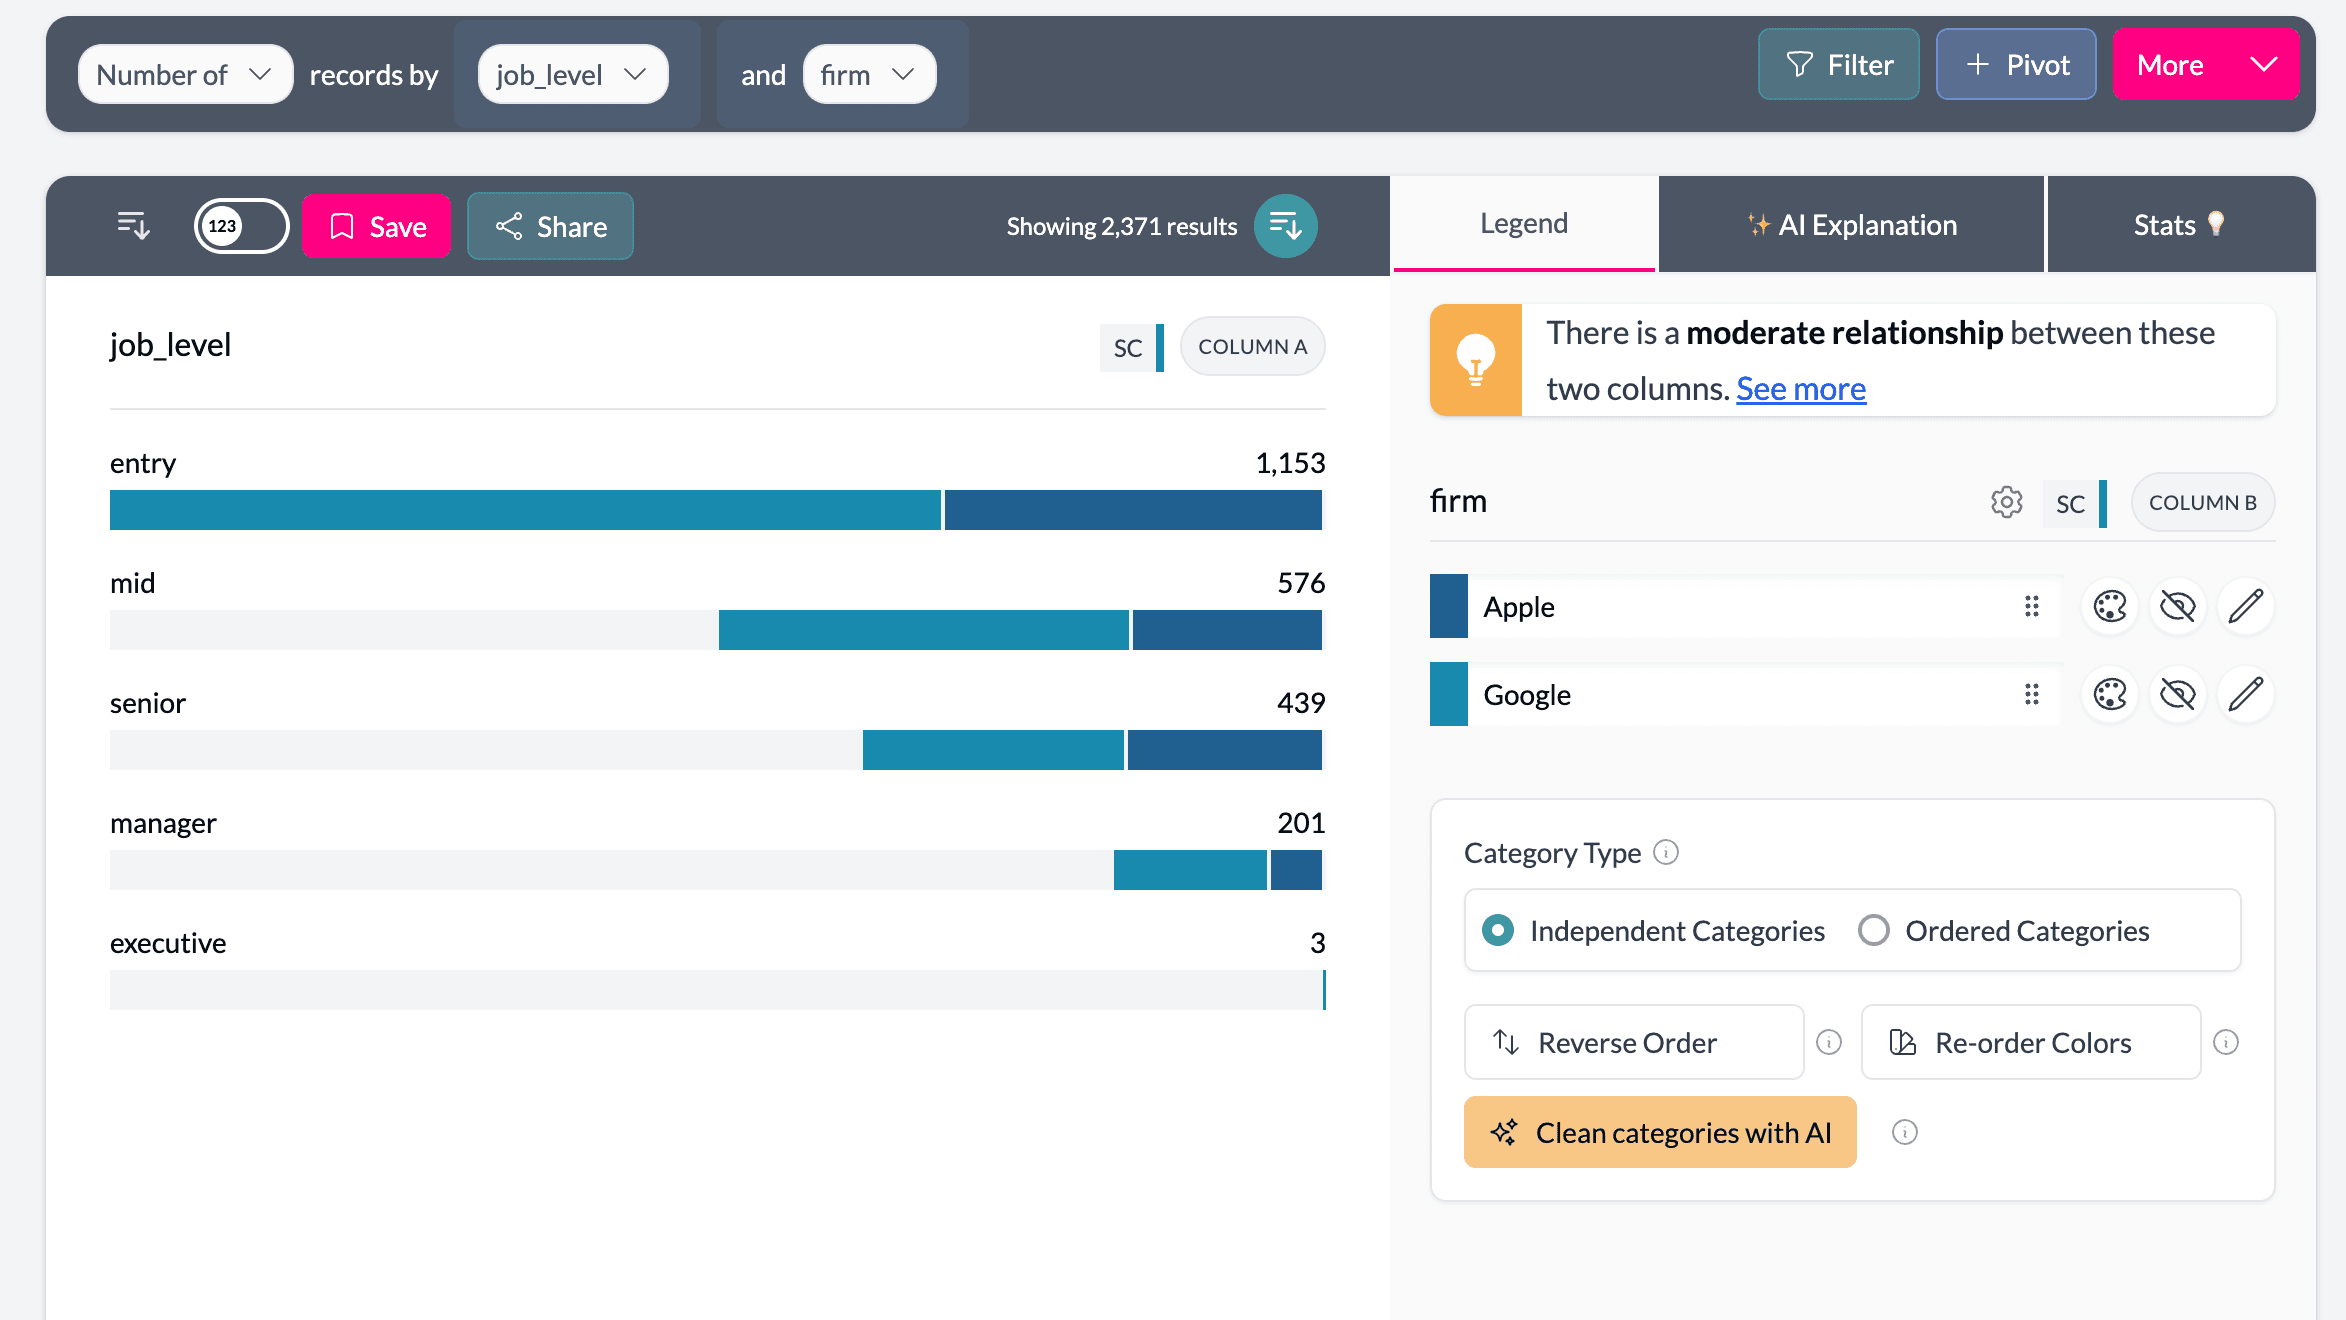
Charts, filters, banner cross-tabs, pivots, and rows stay live while your questions change.
Fusion emphasizes AI-planned quant runs with methods shown alongside the output — strong when the analysis plan is fixed upfront.
Run stats
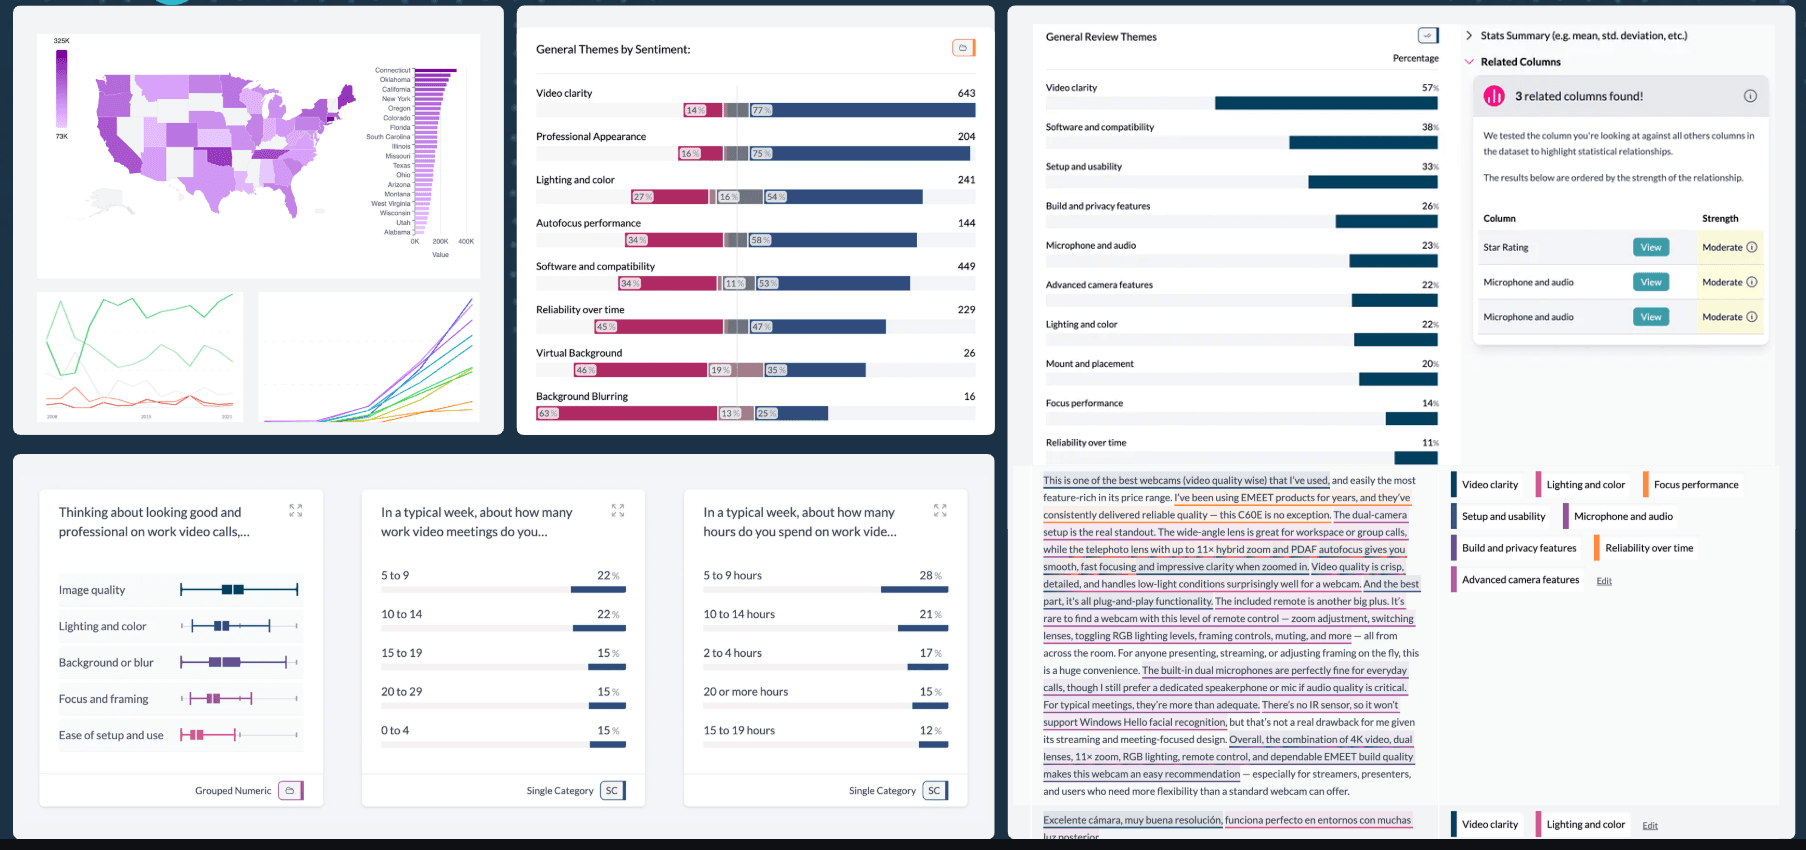
Use related columns, mixed-type clustering, key drivers, significance, segments, and calculated columns as reusable analysis material.
Fusion highlights advanced statistical methods, predictive modeling, segmentation, and tests.
Explain the why
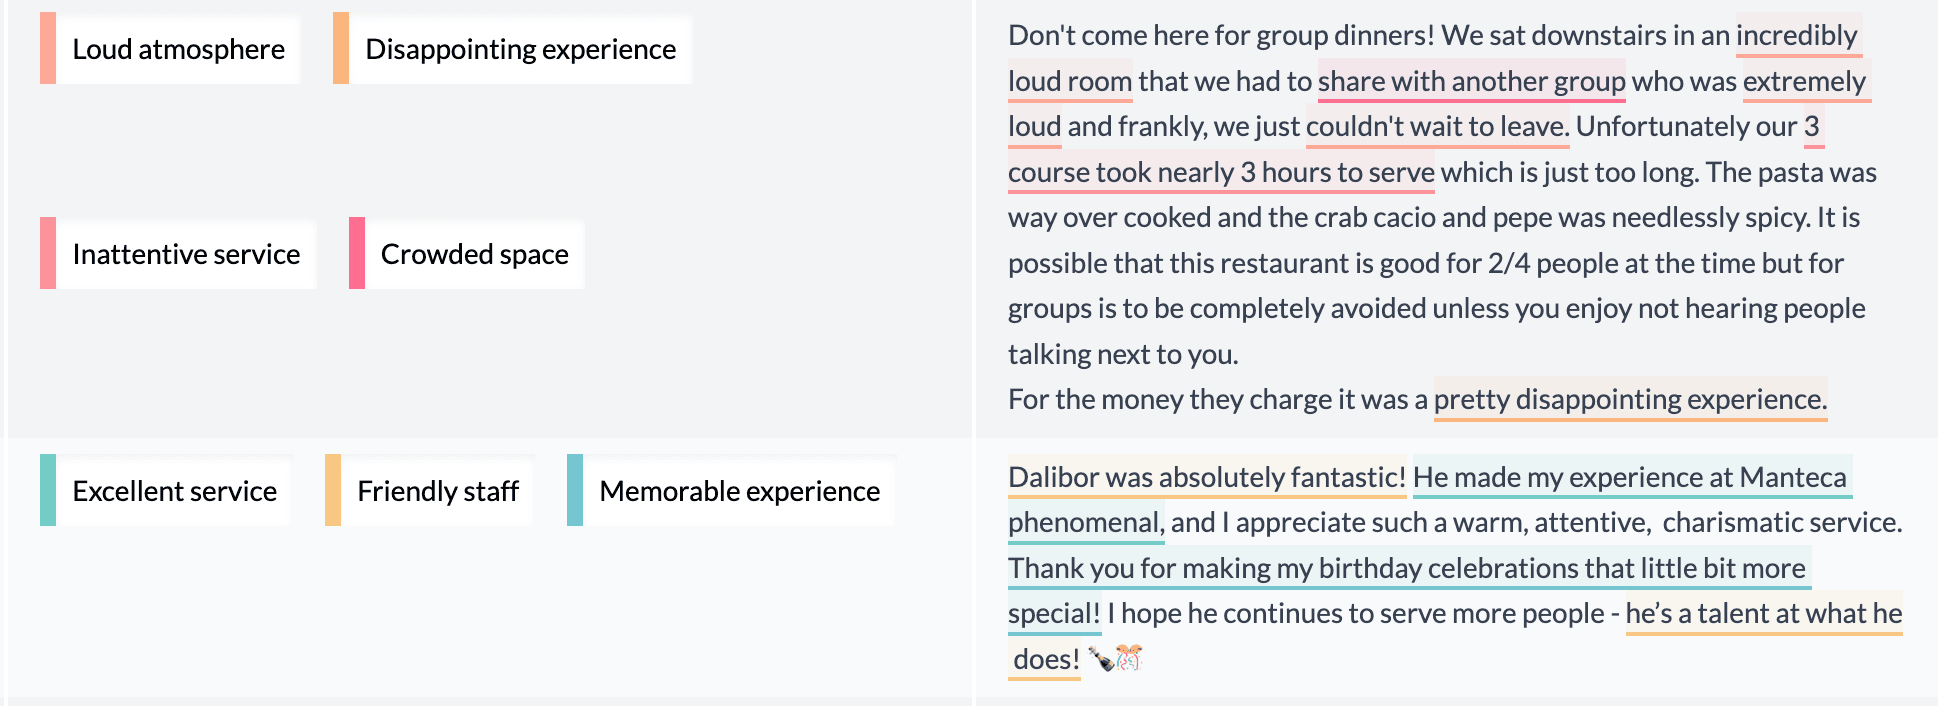
Open-ended coding, sentiment, summaries, and verbatims sit beside the quant results.
Citrus is positioned around quantitative survey analytics and slide-ready reporting.
Share findings
Publish dashboards and Insights Hubs, keep the project explorable, or export charts to PowerPoint.
Fusion emphasizes visualized PowerPoint-ready reporting.
See AddMaple in action
AddMaple keeps upload-to-dashboard speed, statistical exploration, qual analysis, and stakeholder sharing connected in one workspace.
Feature matrix
A practical comparison for teams choosing a survey analysis workflow.
Support: Yes · Partial · No
SPSS .sav import
Yes — SAV plus CSV, Excel, and survey exports
Yes — SPSS-first survey workflow
Automatic data cleaning
Yes — Question grouping, label cleanup, multi-select merge
Partial — Automated survey preparation for Fusion runs
Live banner cross-tabs
Yes — Any column by any column, instantly
Partial — Analysis workflow oriented around planned runs
Key driver analysis
Yes — Random Forest and Elastic Net workflows
Partial — Available in planned runs; AddMaple makes outputs reusable in the project
Clustering and segmentation
Yes — Cluster labels become reusable columns
Partial — Supported in planned workflows rather than live reusable segments
Open-ended text analysis
Yes — Thematic coding, sentiment, summaries, Q&A
Partial — Fusion is positioned mainly for quant surveys
PowerPoint export
Yes — Export charts and findings
Yes — Visualized PPT reports
Shareable interactive dashboards
Yes — Insights Hubs and explorable dashboards
Partial — Survey Explorer emphasizes transparency into results
Hands-on exploration
Yes — Click-to-filter charts, tables, rows, and pivots
Partial — Guided analysis and transparent outputs
File format flexibility
Yes — SAV, CSV, Excel, and platform exports
Partial — SPSS .sav is the headline workflow
Try it on your data
Bring a survey file and judge the workflow by how fast you can clean, explore, model, explain, and share.
Use SAV, CSV, Excel, or a survey-platform export.
Check grouped questions, cleaned labels, multi-selects, Likert grids, and measures.
Use cross-tabs, related columns, clusters, key drivers, themes, sentiment, and verbatims.
Publish a dashboard or Insights Hub, or export the charts and findings you need for a deck.
FAQ
Yes, if you want hands-on exploration, qual beside quant, and shareable dashboards — not only an automated quant run into PowerPoint. Fusion is the better fit when you have a clean SPSS file and a fixed analysis plan you want executed transparently.
Fusion uses AI to plan and execute a defined statistical workflow from SPSS data. AddMaple keeps the file live: you pivot, filter, code text, run key drivers, and publish hubs without waiting for another batch pass when the question changes.
No. AddMaple accepts SAV, CSV, Excel, and exports from Qualtrics, Typeform, SurveyMonkey, and similar platforms. Fusion's workflow is SPSS-first.
Yes. Fusion emphasizes automated PPT reporting from analysis runs. AddMaple exports charts and findings to decks and also publishes explorable Insights Hubs when clients need to keep filtering.
Bring a real survey file and see how quickly AddMaple turns it into charts, pivots, key drivers, text themes, dashboards, and exportable findings.