

A workflow the whole team can run
Clean survey exports, run cross-tabs and stats, code open ends, and publish dashboards — without passing files between tools or relying on one specialist to keep the project usable.

Survey analysis for research teams
Each guide covers a real workflow matchup — SPSS syntax and multi-select setup, Tableau calculated fields, DisplayR reporting overhead, or Crunch cross-tab ops — and where AddMaple fits if speed and breadth matter more than your current stack.
Why teams choose AddMaple
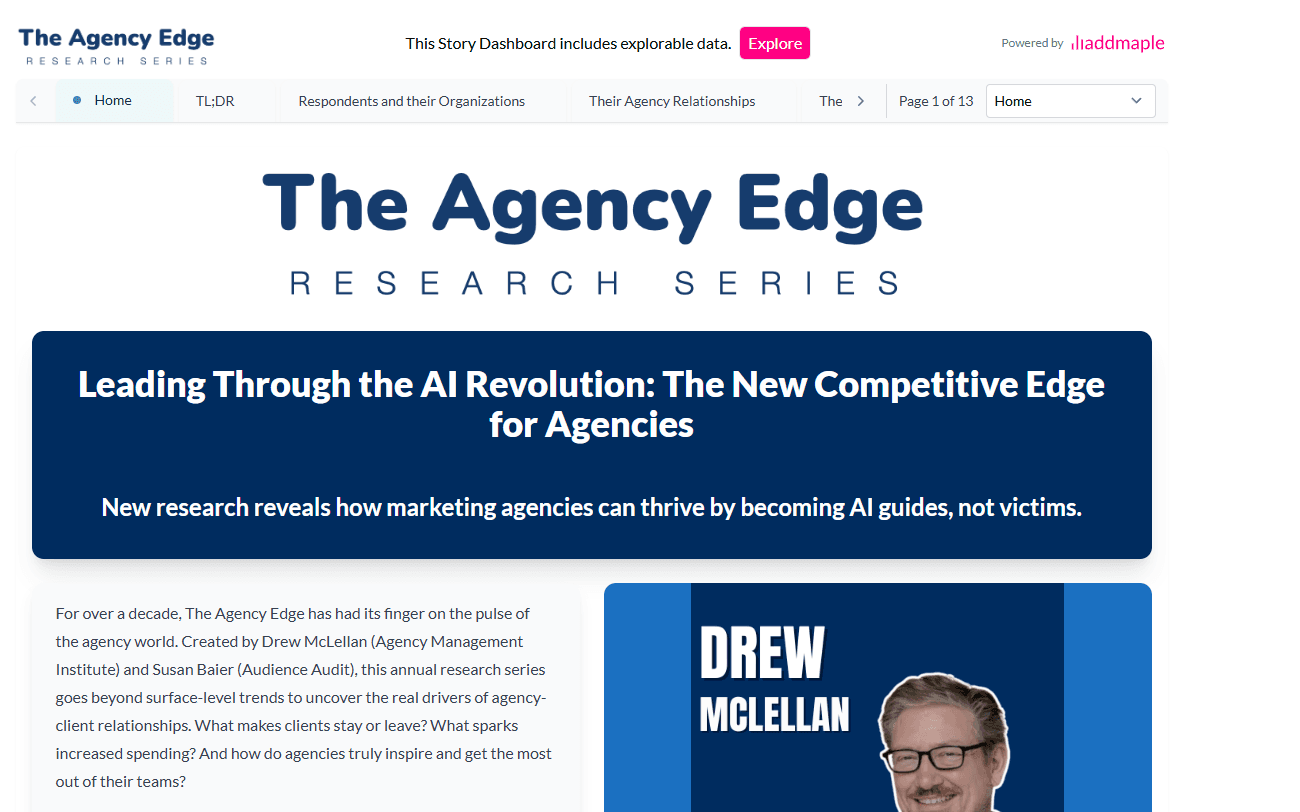
The question is rarely “which tool has more features.” It is whether your next survey project needs another setup sprint — variable recoding, data reshaping, report configuration — or a workspace where exploration, text coding, and sharing stay in one place.
Clean survey exports, run cross-tabs and stats, code open ends, and publish dashboards — without passing files between tools or relying on one specialist to keep the project usable.
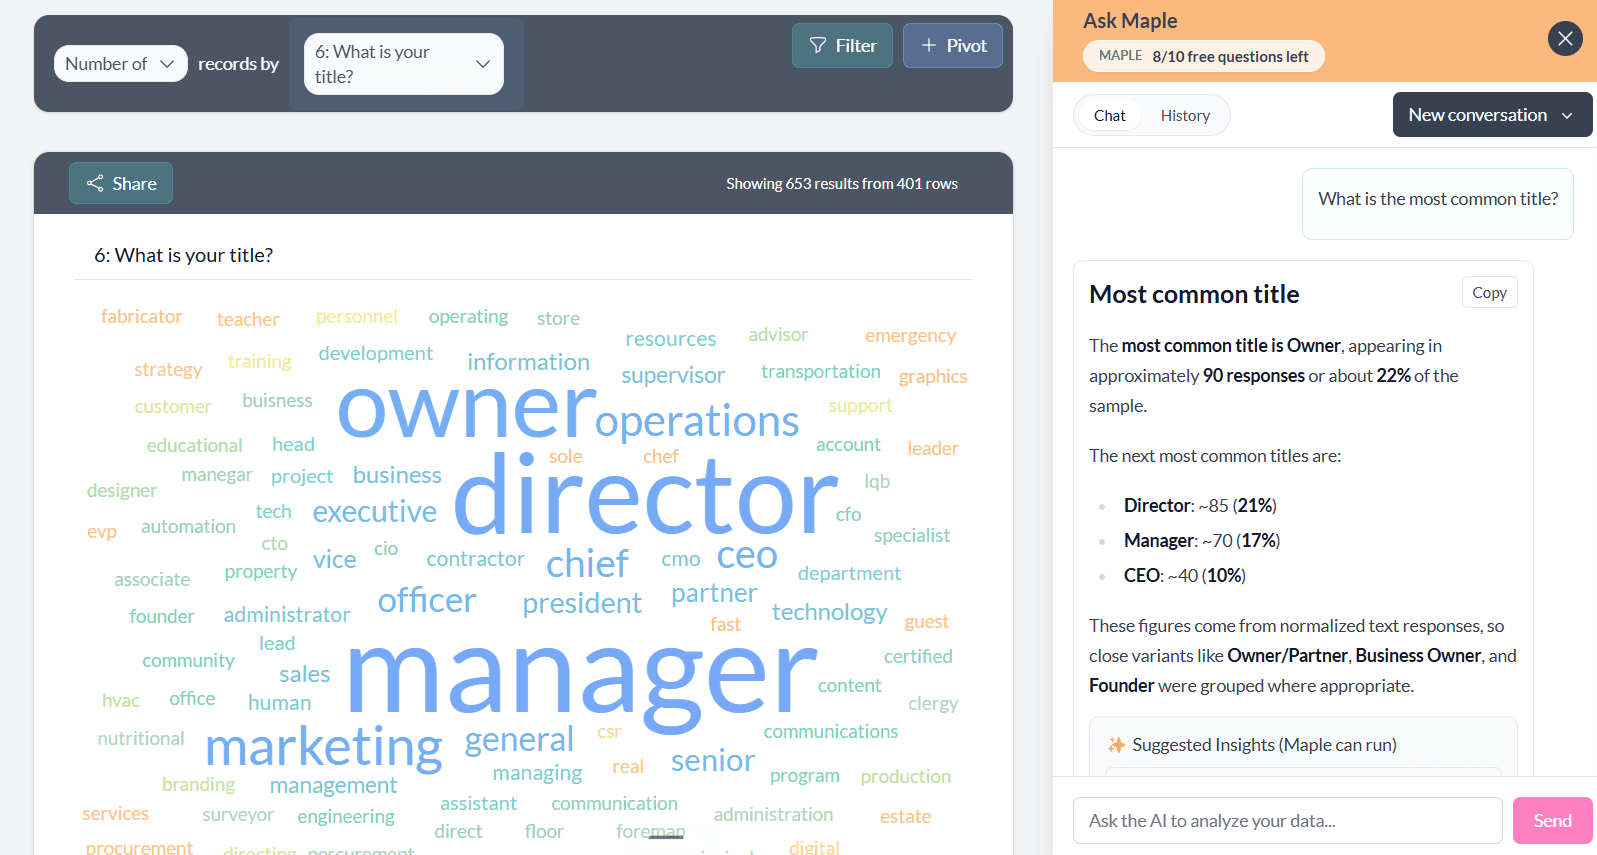
Multi-selects, Likert grids, messy labels, and platform quirks are handled on upload so you start analyzing instead of recoding.
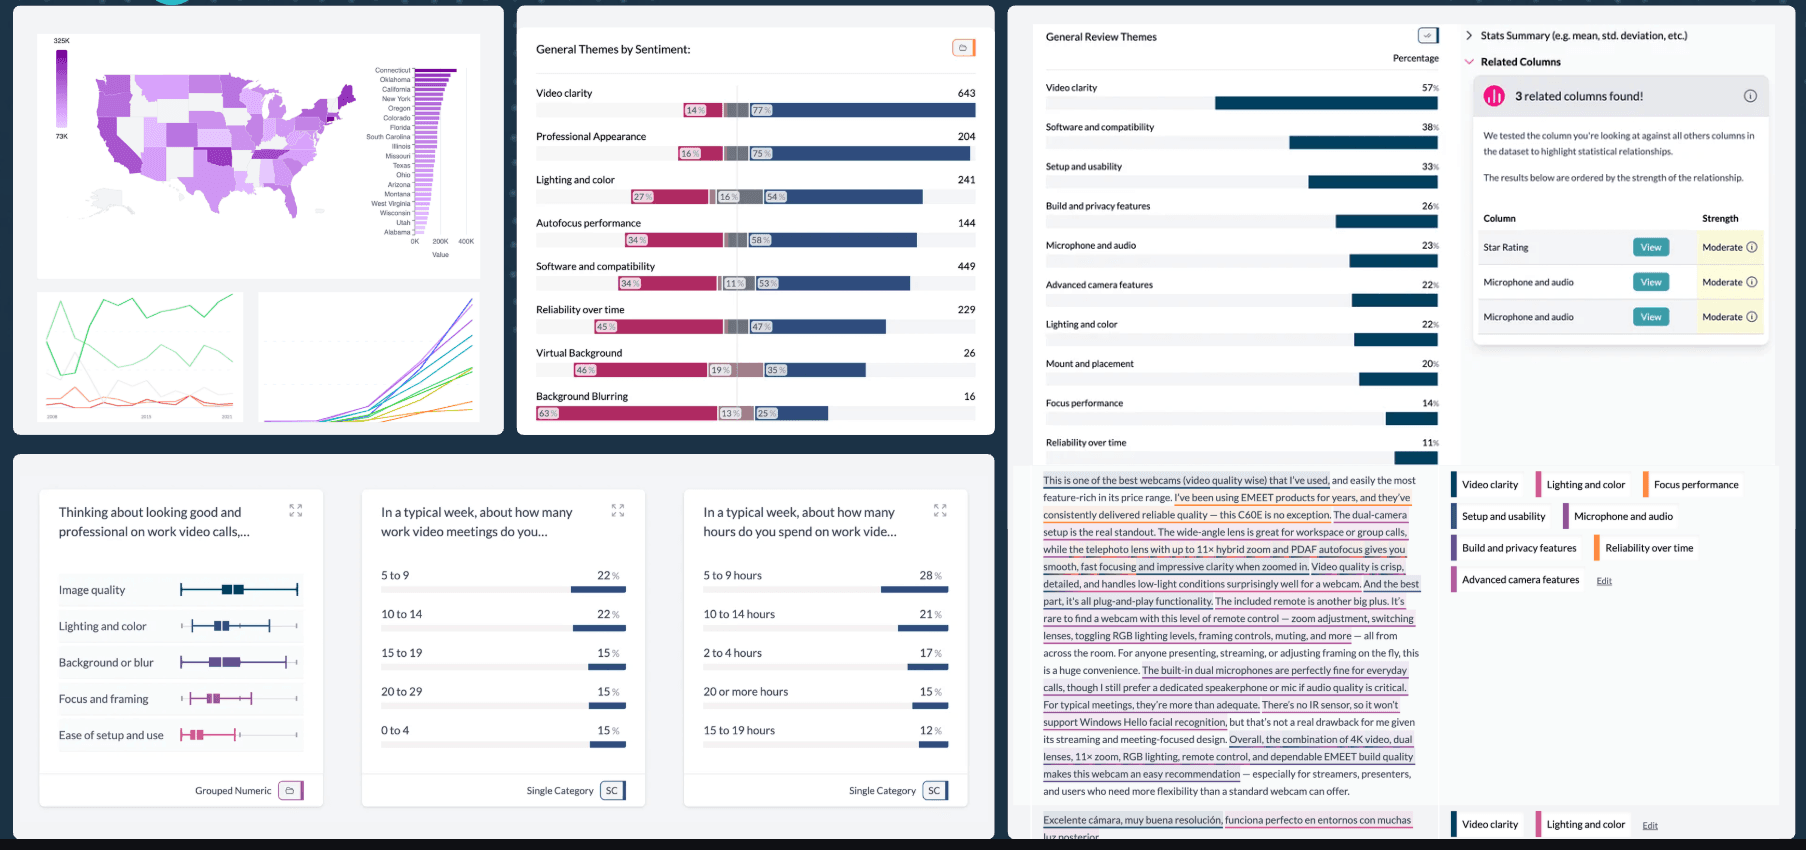
Related columns, clustering, and key-driver output become segments and filters you carry through charts, tables, and client dashboards.
Customer story
“I love working in AddMaple. My team loves AddMaple. My clients love AddMaple.”
Susan Baier, Founder & CEO, Audience Audit — replaced Tableau for explorable survey research.
Read the Audience Audit case study →
Pick the tool you are evaluating. Each page walks through a concrete project scenario, screenshots, feature tradeoffs, and an honest “choose them if / choose AddMaple if” summary.
DisplayR
Compare AddMaple with DisplayR for survey analysis: setup time, R scripting requirements, cross-tabs, open-ended coding, dashboards, and when DisplayR's technical reporting still wins.
SPSS
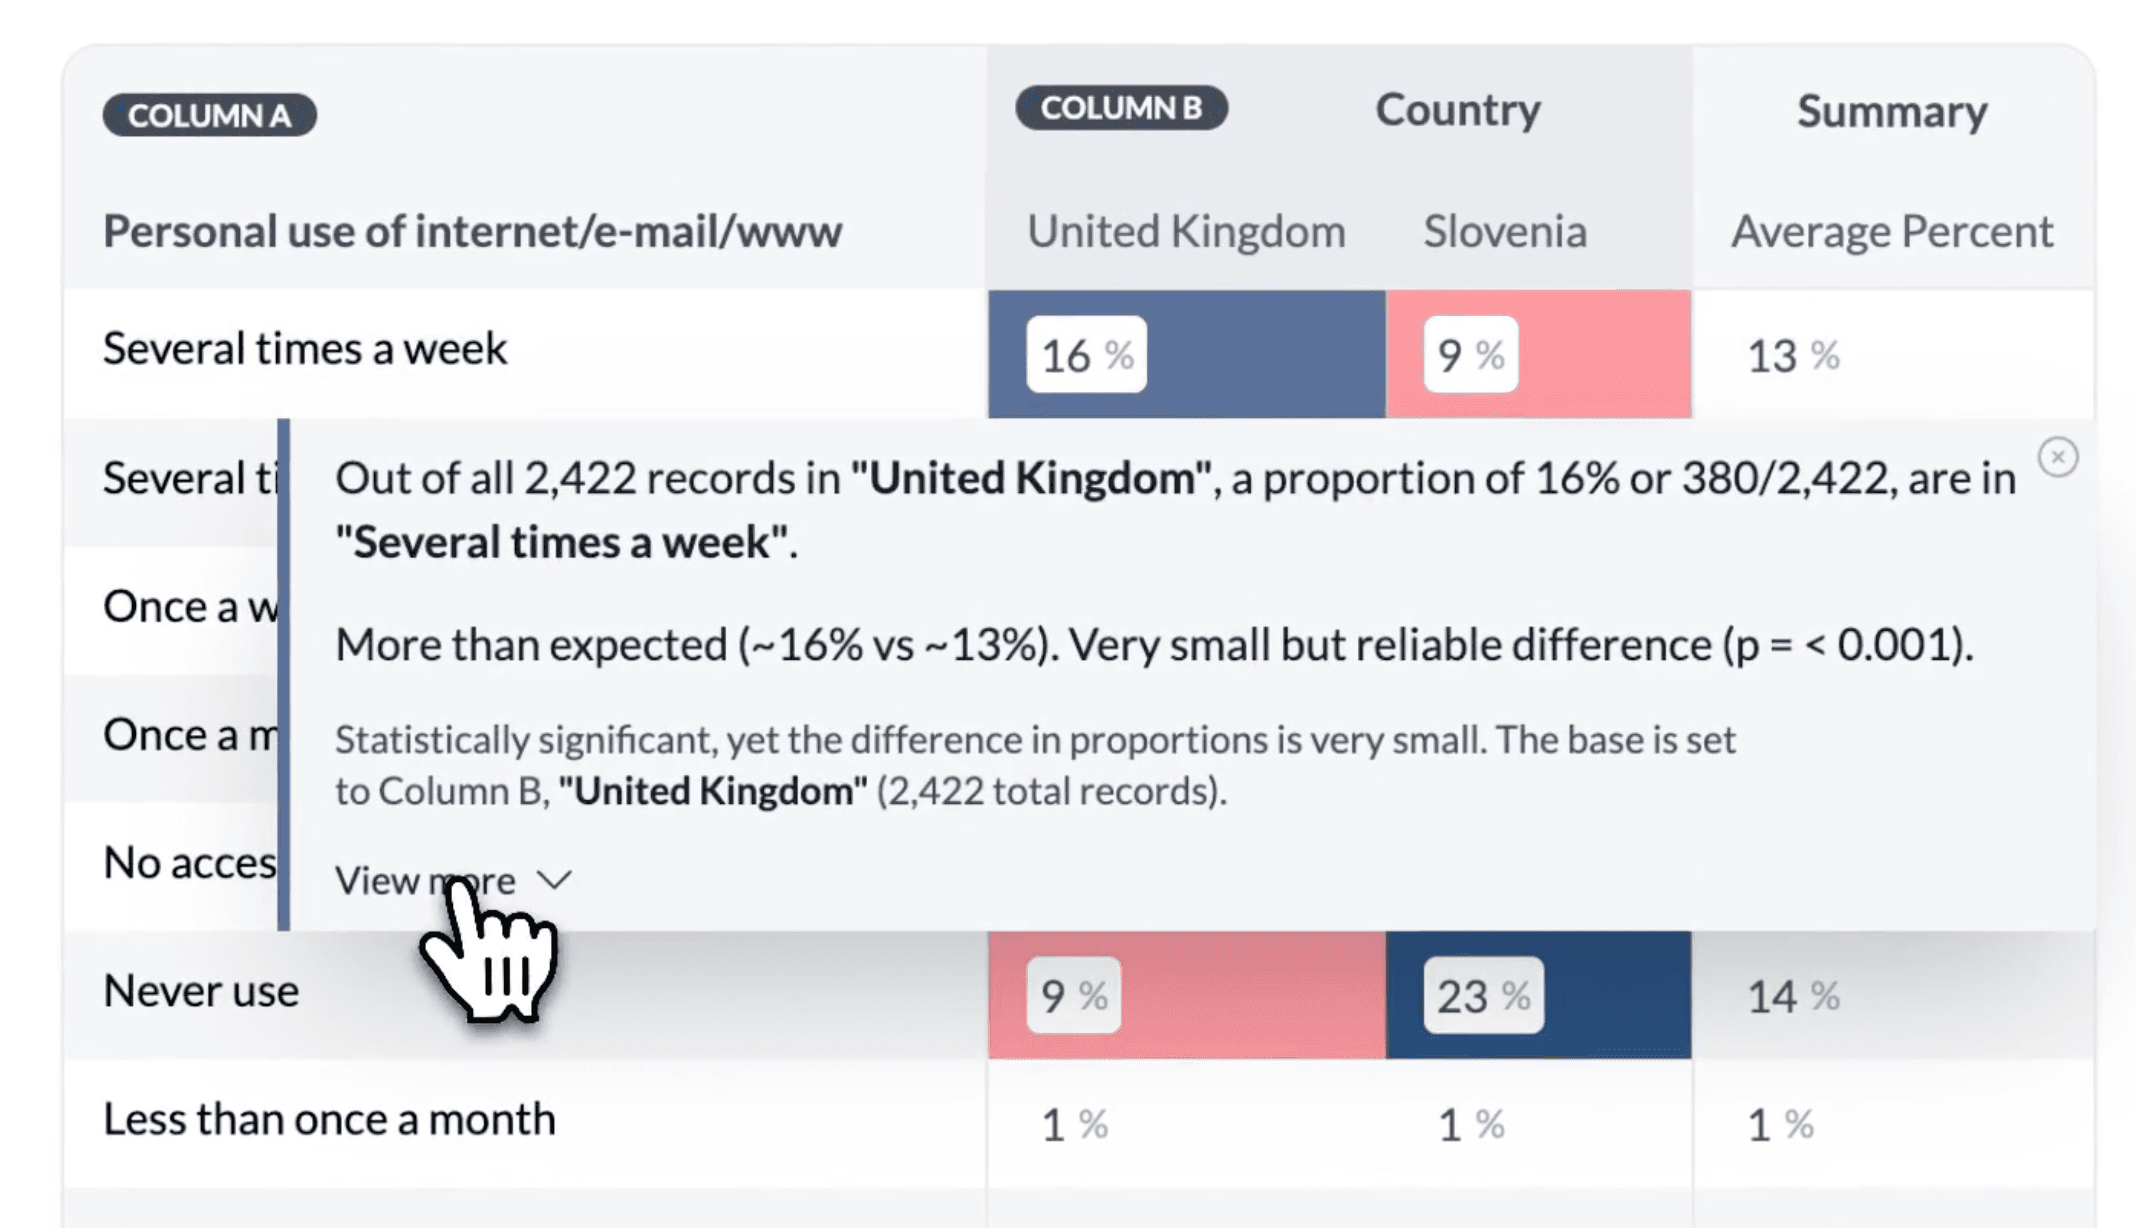
Compare AddMaple with IBM SPSS: variable setup, Multiple Response sets, cross-tab menus, open-ended coding, significance with effect sizes, and when SPSS still wins for modeling.
Tableau
Compare AddMaple with Tableau for survey dashboards: data reshaping, LOD expressions, multi-select logic, text themes, significance testing, and client sharing without viewer licenses.
Crunch.io
Compare AddMaple with Crunch.io: cloud survey storage and cross-tabs vs browser-speed exploration, AI text coding, auto-stats, Insights Hubs, and when Crunch's collaboration model fits.
Book a demo with your team or explore sample data to see how fast AddMaple moves from upload to charts, stats, themes, and shareable dashboards.