Add Maple

AddMaple V3 is here! Learn more

Need Insights Yesterday?

Meet your
All-in-ONE
INSIGHTPower Tool

Drop a CSV or SAV and, in seconds, see charts, text themes, and the key drivers behind every metric - ready to share.

Five reasons people choose AddMaple

1

Instant insight from raw SAV, CSV, Excel files

In under a second you get ALL columns summarized into tables, pivots and charts, WITH a significance map of every variable. No setup, no formulas, no waiting.

2

Unified quant + qual tool

Direct an AI agent to code thousands of free-text answers into themes, sub-themes and have themes ranked by Likert scale sentiment. Now you can explore the relationships between the categories, numbers and words on the same screen.

3

Intuitive exploration

Click any bar, point, or theme tag, and filter all responses instantly. See ranked relationship charts by one variable, e.g. Age. Ask Maple, our agent questions as they come to you.

4

Local-first privacy

All processing happens on your device, in your browser. The data never leaves your device unless you choose to publish a share link.

5

Story-first, Friction-free sharing

Publish an explorable dashboard including your images and videos, behind a simple password-protected URL. Viewers can view - without individual viewer licences.

AddMaple Pricing

Starter

Intelligent sandbox
$59/month
$599/yearSave 15%

Experience AddMaple in action.

Turn raw survey files into clean, presentation-ready insights fast.

  • Upload raw CSV, SAV, or Excel and get analysis-ready outputs in minutes
  • Use AI explanations and limited AI chat to move faster with confidence
  • Build modern dashboards and export presentation-ready charts
Get started

Included in Starter

AI explanationsLimited AI chatBeautiful visualizationData cleaningDashboardsPresentation-ready exports

Business

For professional research
Contact Us

Faster clarity from complex research

AddMaple surfaces the relationships and drivers that matter, helping you move from raw results to confident conclusions quickly.

Key driver analysis, segmentation, and AI thematic coding are built into one seamless workflow, with outputs grounded in real statistics and ready to share.

For insights teams, agencies, and independent consultants.

Included in Business

Automated Statistical TestingRegression + weightingSignificance tablesKey Driver AnalysisAI thematic codingSentiment analysisAdvanced AI AgentMixed-type key driversMixed-type clusteringMulti-file projectsTracker workflowsPrivate dashboardsTeam workspaceCustom integrations + SSOPriority onboarding

Why professional teams choose AddMaple

Insight without the hunting

AddMaple automatically surfaces the relationships and differences that matter, so you start with signal, not guesswork.

  • Automated testing across variables
  • Regression, weighting, and significance built in

Grounded in rigorous statistics. Designed for speed.

Drivers and segments, made practical

Powerful modeling across mixed data types, without heavy setup.

  • Mixed-type key driver analysis with ranked impact outputs
  • Mixed-type clustering with clear segment interpretation

Advanced methods. Simple to use.

Open ends that connect to the numbers

AI coding isn't a side tool. It's integrated.

  • Thematic coding and sentiment at scale
  • Themes linked directly to segments and quantified results
  • Train AI on your taxonomy

Qual and quant stay in one workflow.

Built for ongoing research

Designed for teams running recurring programs.

  • Multi-file projects and tracker workflows
  • Dashboards for continuous reporting

Built for continuity, not one-off analysis.

From analysis to delivery

Move from findings to shareable outputs in one system.

  • Editable PowerPoint exports
  • Optional Excel tables
  • Secure private dashboards with embedded AI

No handoff friction.

Data Prep and Dashboard Creation

The AddMaple team will clean and organise your data, and create a 5 page dashboard highlighting insights from your dataset

From $1,000
Contact sales

Explorable Dashboards with unlimited viewers

Publish private explorable dashboards to unlimited viewers

Statistical significance tables

See whether differences between two variables are statistically significant, e.g., Age by Satisfaction

Statistical testing

Show tested, ranked relationships across all columns

AI Agent

AI-assisted analysis inside the dashboard

PowerPoint Exports

Allow your dashboard viewers to export editable powerpoint slides

Contact sales

Are you an NGO, academic, or student?

Explore AddMaple Impact for special pricing →

What Our Customers Say

Hear from researchers and analysts who use AddMaple every day

From Raw Data to Explore Data

Questions we hear most

Do I need a stats background?

No. AddMaple runs key drivers, sig tests, and Likert analysis automatically - insights in seconds, no SPSS required.

Will my data be safe?

Yes. All processing is local-first in your browser; nothing leaves your machine unless you choose to publish.

Can I share dashboards without extra licenses?

Yes. Unlimited viewers are always included - no surprise Tableau-style fees.

Does it work on Windows and Mac?

Yes. AddMaple runs in your browser, so it works anywhere - Windows, Mac, Linux, even Chromebooks.

Can I try it free before I commit?

Yes. Explore our curated sample datasets with full features — no credit card required. Upgrade to connect your own data.

Why Choose AddMaple?

AddMaple isn't another analytics tool with a steep learning curve, complex code, or endless trial-and-error just to see one chart. 
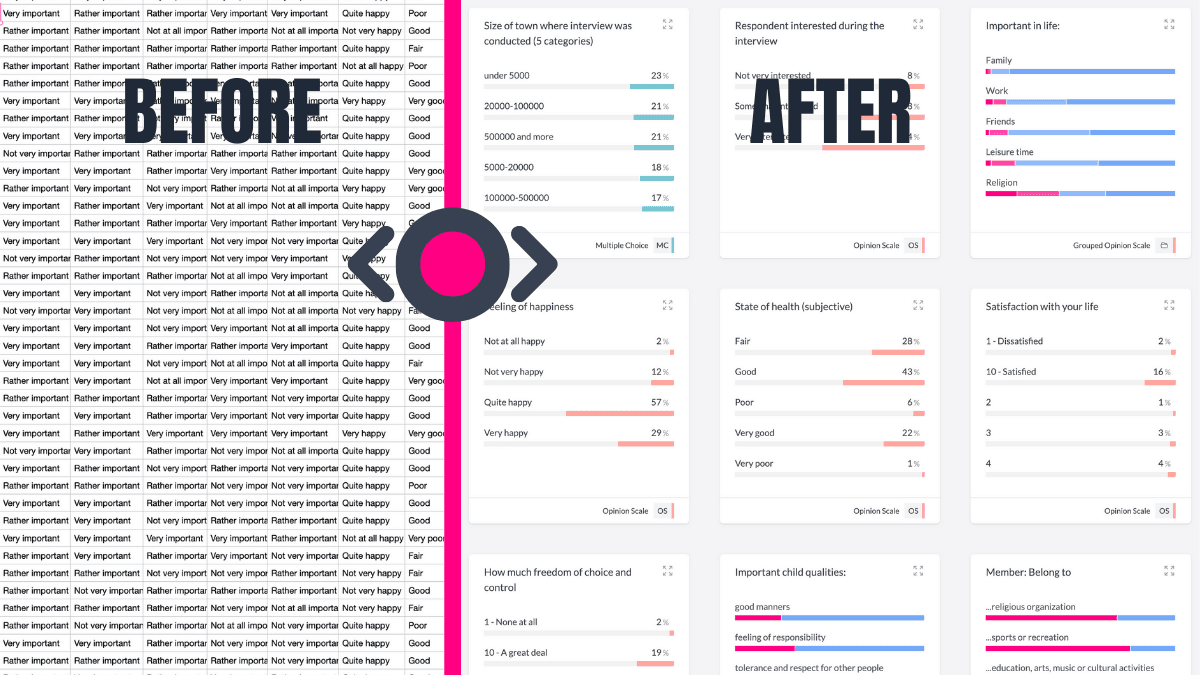
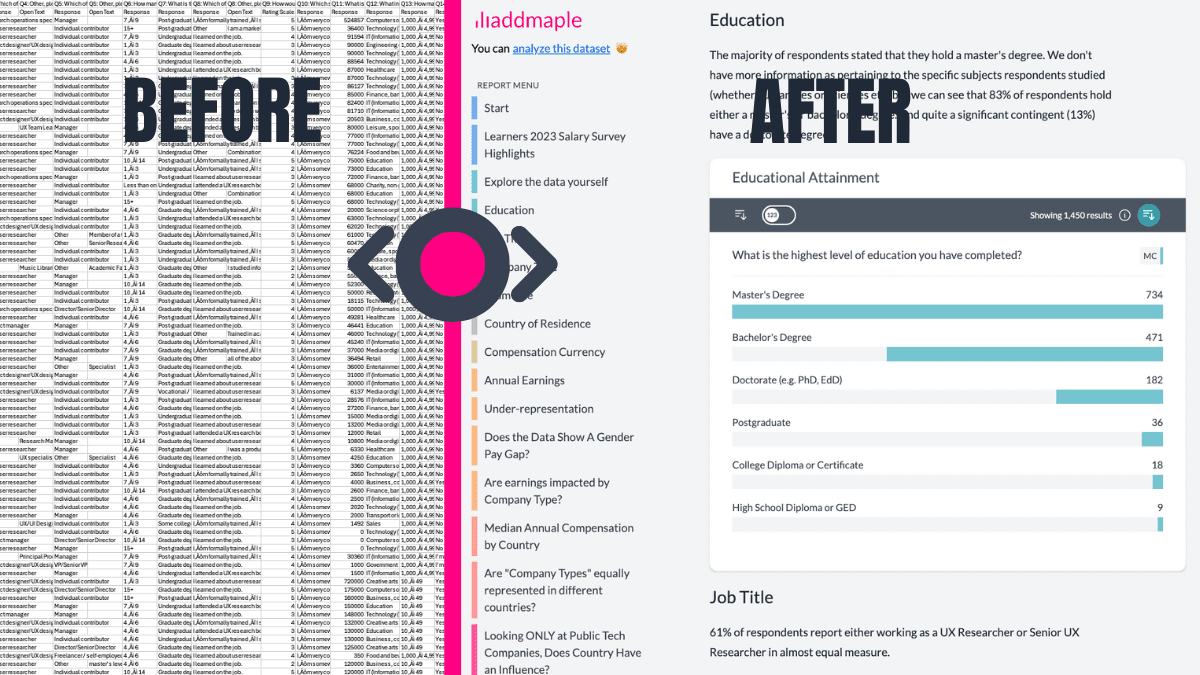
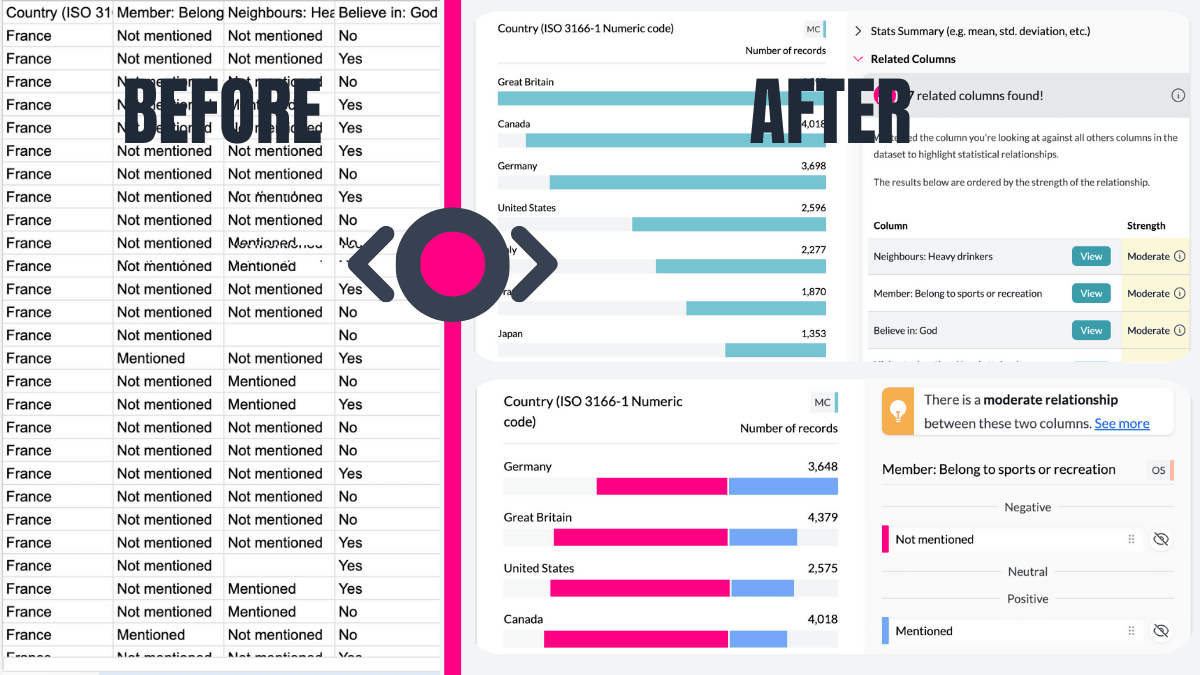
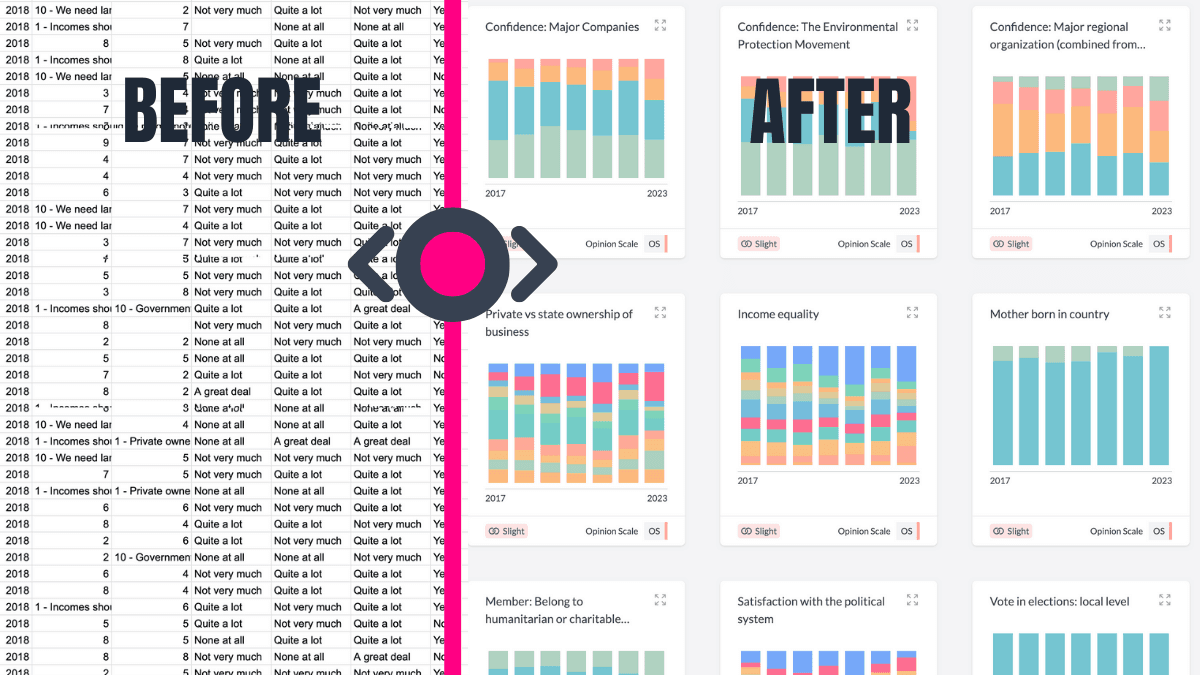
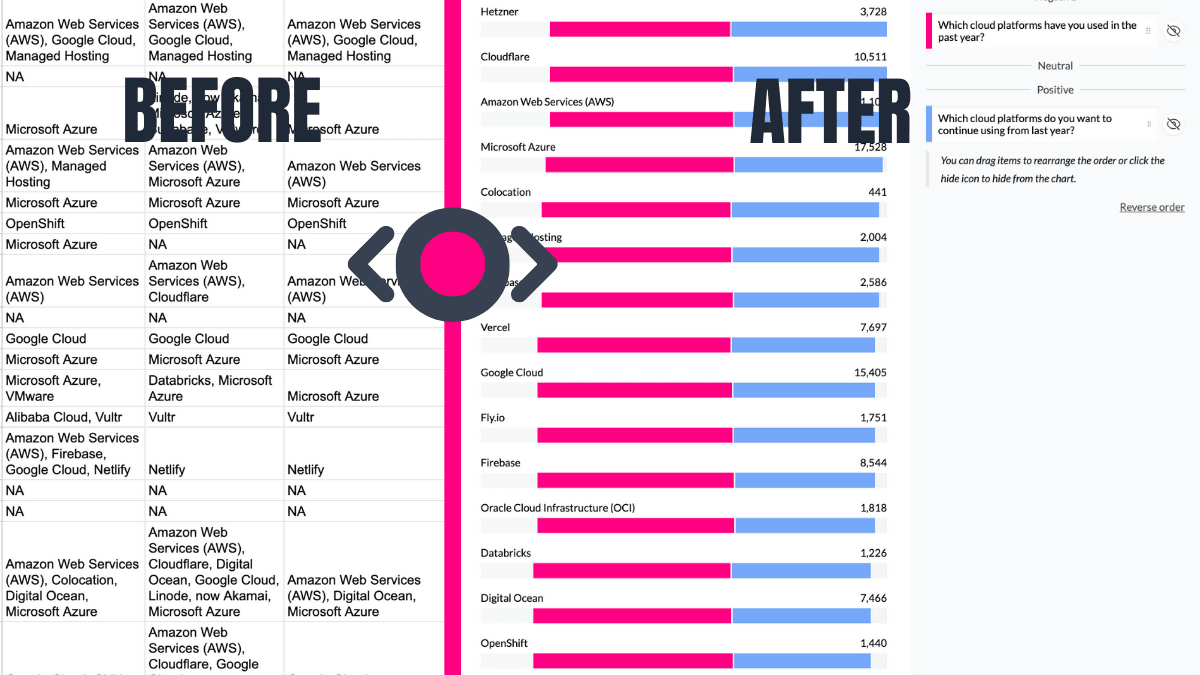
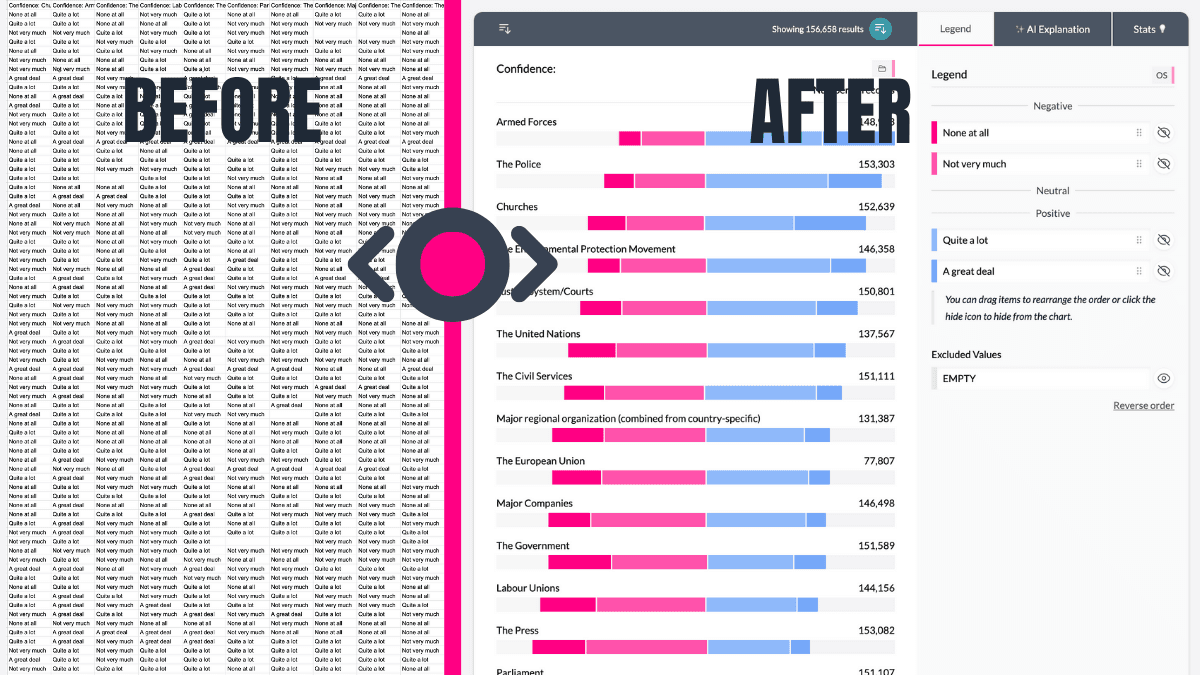
Instead, we turn your raw data instantly into an interactive dashboard, ready to explore in seconds. Effortlessly understand your customer data, save meaningful insights as you go, and share them through thoughtfully designed story dashboards—encouraging your whole team to dig deeper and discover more. 
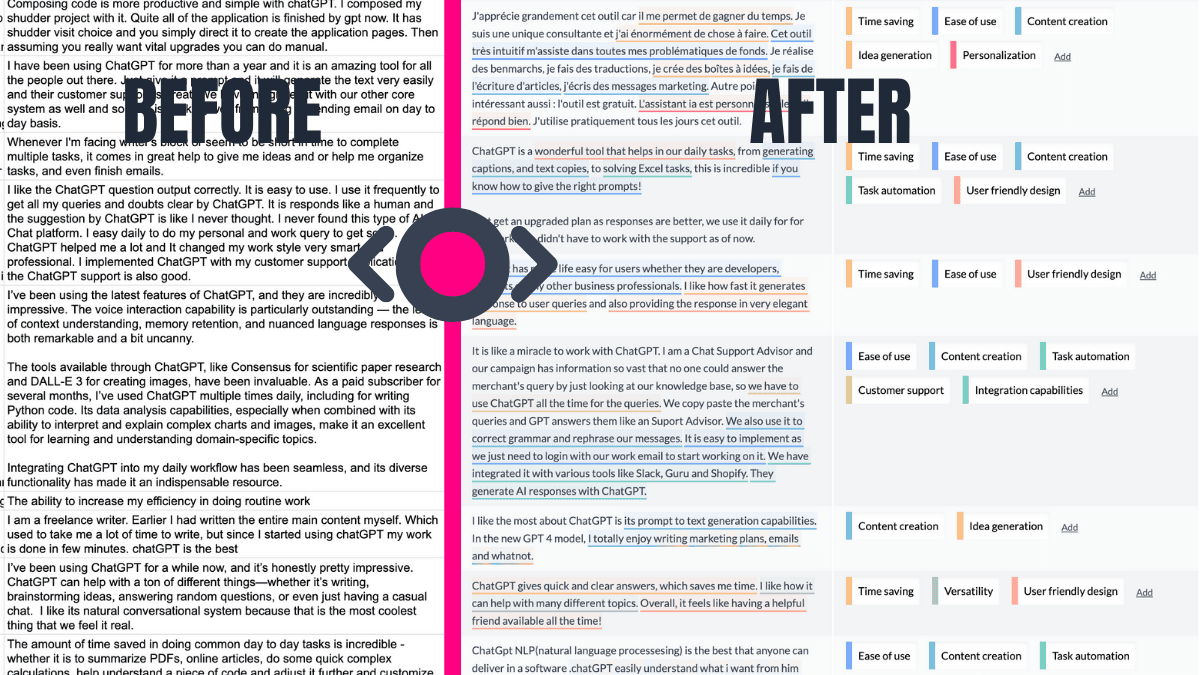
We blend powerful AI-driven qualitative insights, seamless quantitative analytics, and visually compelling dashboards - all at a fraction of the complexity and cost of legacy platforms.

How We're Different:

Unlimited Dashboard Viewers:

Share your dashboards freely—report readers never require accounts or extra fees.

No Hidden AI Costs:

Unlike Tableau, we include AI-powered analytics without additional fees.

Easy and Fast Setup:

No complicated API keys (like DisplayR). No complex cloud publishing configuration (like PowerBI). Just easy, secure sharing.

How We Compare

See how AddMaple stacks up against other analytics platforms across the features that matter most

Legend: = native / out-of-the-box = possible but limited / extra setup = not provided
Feature / OutcomeAddMapleCrunch.ioTableauDisplayRNVivo (+AI)SPSS (+Text)Co-Loop
Instant insight (all cols visualised < 1 s)
Automated key-driver analysis (quant + qual)≈ (extensions)≈ (manual)
Flexible merging & segment creation
Save charts to live dashboards
AI sentiment by open-text themes≈ (add-on)✓ (OpenAI key)
AI chart interpretations / narratives
AI auto-coding into themes / sub-themes✓ (paid AI)
Traceable colour-coded text ↔ theme links
AI classification (cities → regions, etc.)
AI prompt-based summaries
Quant + Qual in one tool
– Crosstabs & sig-tests on coded text
– NPS / scores by theme
Imports SAV / CSV / Excel
Column-level password encryption
Interactive / shareable dashboards
"Guess-the-chart" viewer interaction
Video / images inside dashboards
Unlimited external viewers✗ (viewer licences)
Find pain-points & share insights same-day✓ One-click surfacing & instant dashboards≈ (manual setup)

Why AddMaple Wins

1.

Find pain-points instantly

Automatic surfacing of the issues driving NPS, CSAT, UMUX.

2.

Share insights the same day

Unlimited viewers, no log-ins, no extra licences.

3.

AI-first + stats-strong

Thematic coding, sentiment, key-driver stats, crosstabs-all in one place.

4.

Fair, transparent pricing

Pay only for what you need. Explore sample datasets free. No hidden fees or complex licensing.

Trusted by Leading Institutions

A few of the 20,000+ people cruising from data exports to reports

Stanford UniversityBerkeleyNew York UniversityCornell UniversityHarvardUniversity of Texas at Austin
Life Saver 01

Starts You with Summarised Data

Forget starting with raw columns. AddMaple instantly summarises your data into tables, pivots, and charts. Begin exploring your survey results with answers, not setup tasks.

Starts You with Summarised Data
Life Saver 02

AI-Powered Thematic Coding

Transform open-ended responses into themes, fast. AddMaple's AI not only categorises text but highlights the exact phrases behind each theme. This means you can go from messy text data to meaningful insights with full transparency.

AI-Powered Thematic Coding
Life Saver 03

Shares Insights That Live On

Static reports? Not here. AddMaple makes it easy to create interactive dashboards, shareable reports, and charts. Say goodbye to PowerPoint slides that get buried in inboxes-now your findings are explorable and engaging for colleagues and clients.

Shares Insights That Live On
Life Saver 04

Automatically Reveals What Matters

Find insights faster. AddMaple runs statistical significance tests across all columns-including AI-generated themes-and ranks relationships by importance. This means you're instantly guided to the patterns and trends that matter most.

Automatically Reveals What Matters
Life Saver 05

Handles Dates and Numbers with Ease

AddMaple takes the frustration out of analysing dates and numbers. It detects date ranges for you, enabling easy segmentation by time period. For numeric data, AddMaple creates histograms and grouped ranges right away, so you can uncover patterns without spending hours on setup.

Handles Dates and Numbers with Ease
Life Saver 06

Automates Multi-Tag Analysis

Handling "Select all that apply" or multi-tag columns? AddMaple automatically detects these, summarises them into clear visual charts, and skips the hassle of manual column-splitting or formulas.

Automates Multi-Tag Analysis
Life Saver 07

Turns Likert Scales Into Pivot-Ready Visuals

AddMaple takes your Likert-scale questions to the next level with elegant, neutral-aligned charts. Instantly see where opinions fall, then pivot by any other column-like demographics or preferences-to dig deeper into your data.

Turns Likert Scales Into Pivot-Ready Visuals

Ready to transform your data into insights?

Start with Starter, then move to Business when your research needs deeper analytics, client delivery workflows, and team scale. You can also explore sample datasets free first.