Wordle Average Calculator
Calculate your Wordle average in seconds.
Enter your guess distribution to get mean, median, mode, and detailed distribution stats instantly.
If you need a tool to help with deeper data analysis, try AddMaple. We help you move from raw data to charts, pivots, thematic coding, and shareable dashboards in minutes.
Wordle Average Calculator
Enter your Wordle guess distribution below to calculate your mean, median, and other statistics.
No data entered
Enter your guess counts to see the stats.

“I don’t think I’ve ever had a relationship with a software company that was as responsive. I love working in AddMaple. My team loves working in AddMaple. My clients love AddMaple.”
Delivering Insights Shouldn't Take This Long
Most analysis tools aren't built for surveys and feedback. They don't handle "select all that apply" or grids. Analysing a single question takes more steps than it should. Insight discovery hinges on outsourced data table prep, then endless Excel scrolling - hoping to spot what is important.
Too much time lost on data preparation.
Verbatims are either ignored, or analyzed in other tools, losing all links to the quant data.
Spreadsheets break on large files and require endless formulas.
Insights trapped in decks; dashboards out of the question - too slow and costly.
Old-school stats, steep learning curve, one manual test at a time, leaving insights untapped.
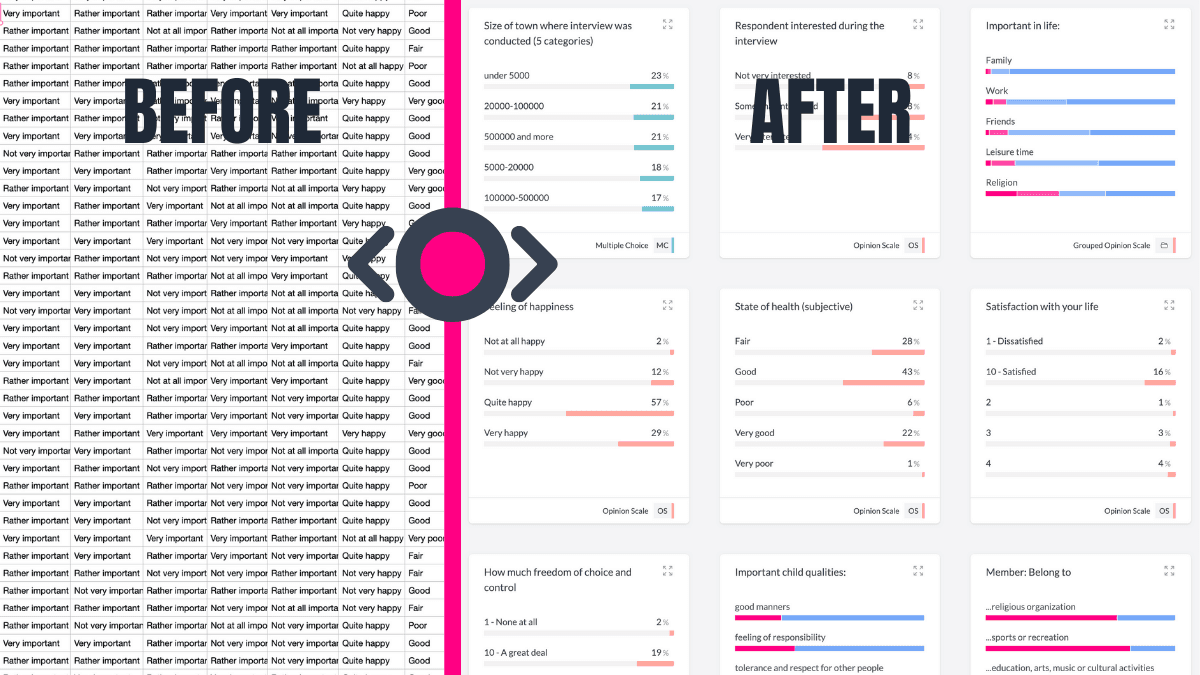
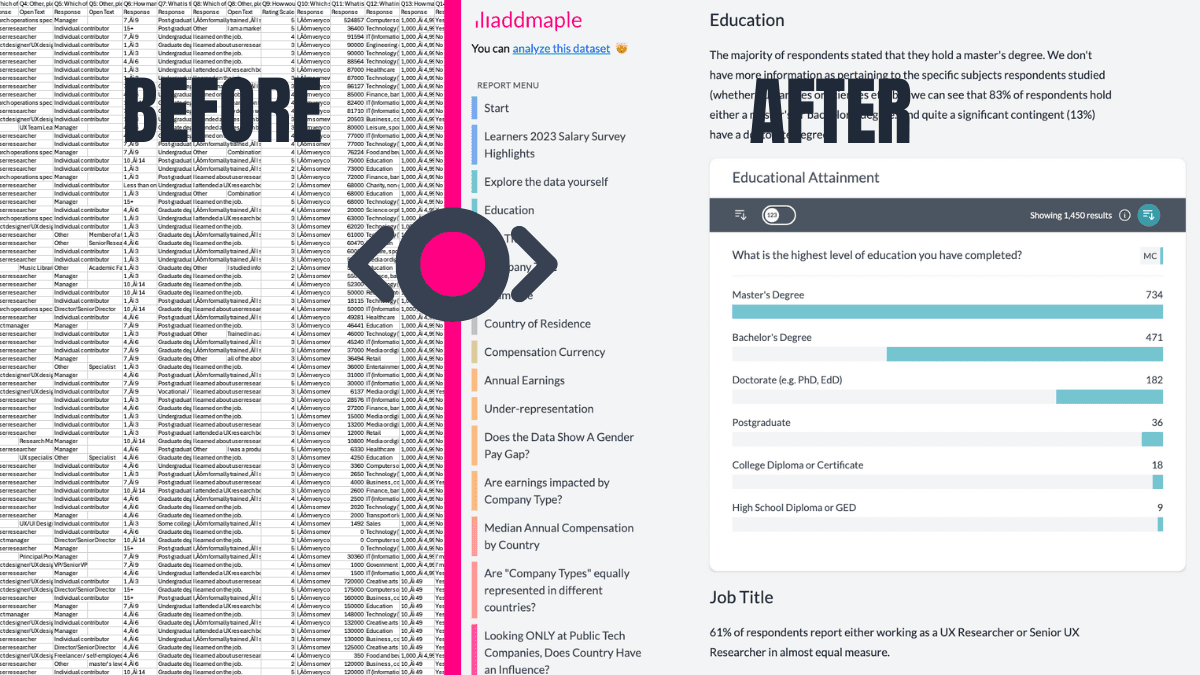
Starts You with Summarised Data
Forget starting with raw columns. AddMaple instantly summarises your data into tables, pivots, and charts. Begin exploring your survey results with answers, not setup tasks.
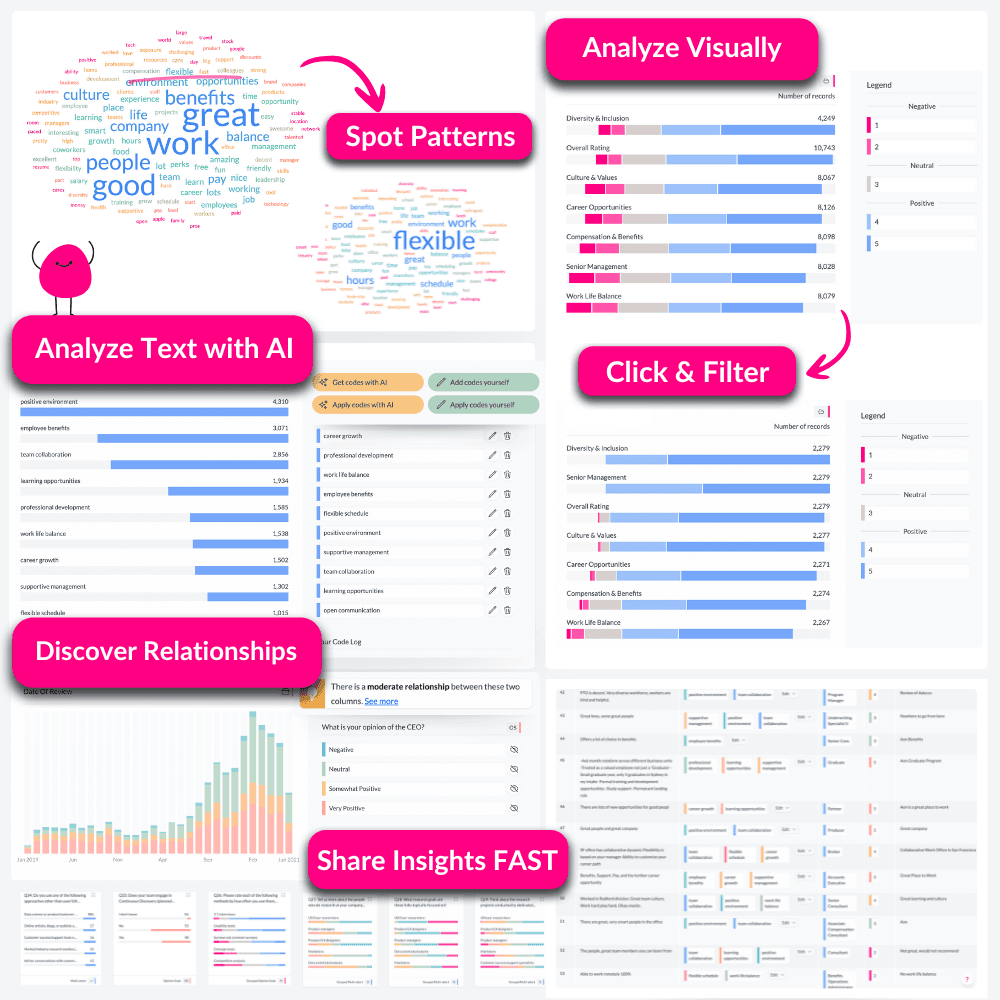
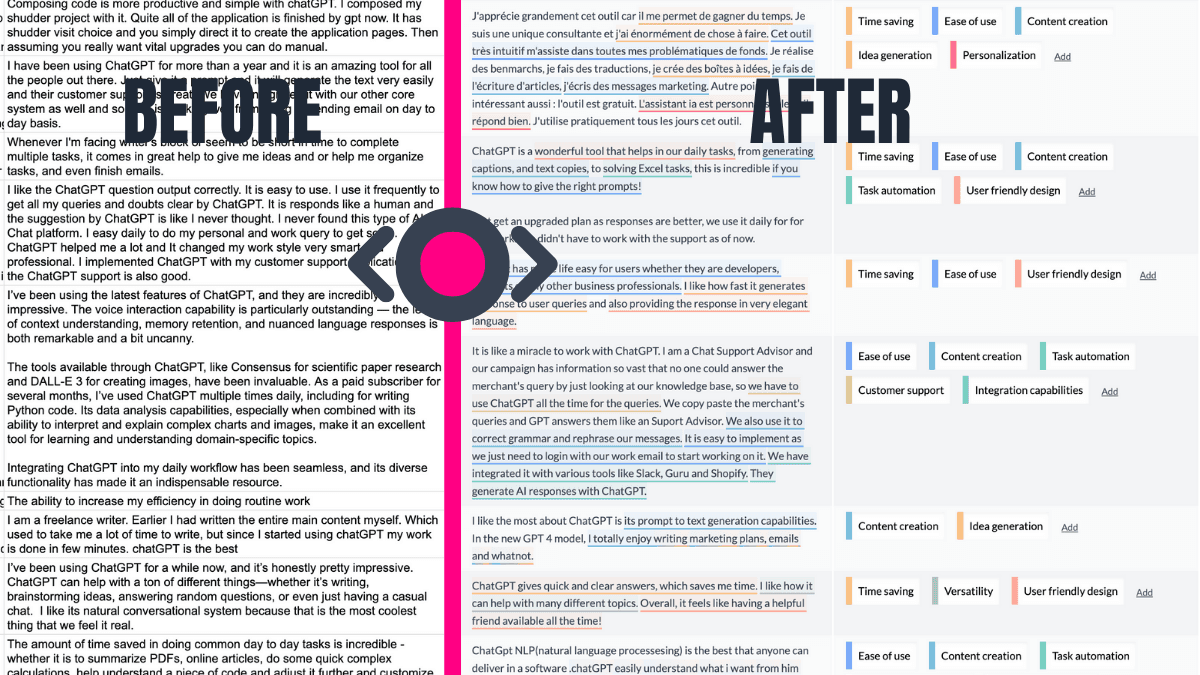
AI-Powered Thematic Coding
Transform open-ended responses into themes, fast. AddMaple's AI not only categorises text but highlights the exact phrases behind each theme.
Shares Insights That Live On
Create Insights Hubs that stakeholders can explore, instead of static files that go stale.
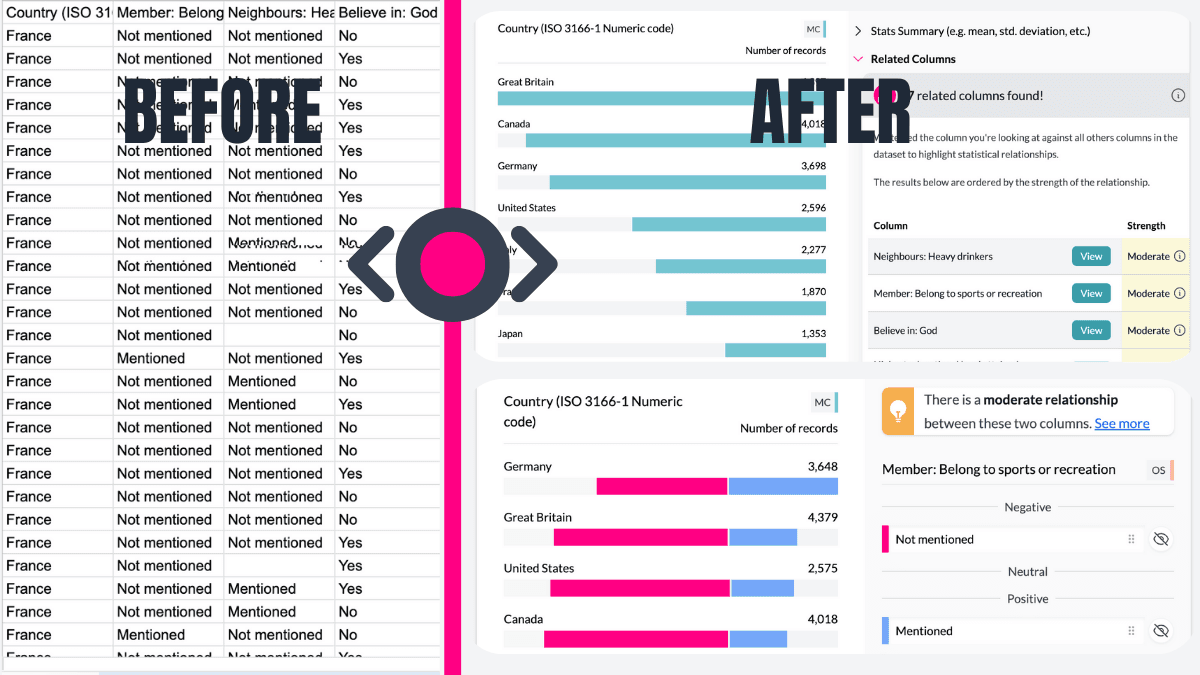
Automatically Reveals What Matters
AddMaple runs statistical significance tests and ranks relationships by importance so you can focus on what matters.
AddMaple: From Raw Data to Insights in Seconds
Cut down the time from raw data to insights you can share.
AddMaple combines an explore-ready dashboard, a powerful stats engine, and explainable AI to help you make data-driven decisions - no data wrangling required.
Analyze Open-Ended Questions with AI
Theme thousands of responses in minutes, then explore those themes alongside your quant data.
Qual and Quant in One
Combine quantitative metrics with qualitative feedback in one place.
No Data Wrangling Needed
Bring data from anywhere and get an explore-ready dashboard instantly.