


Prepare
Weighted analysis
Apply survey weights to tables, banners, and analysis so results reflect the intended population — without exporting to a separate weighting tool.
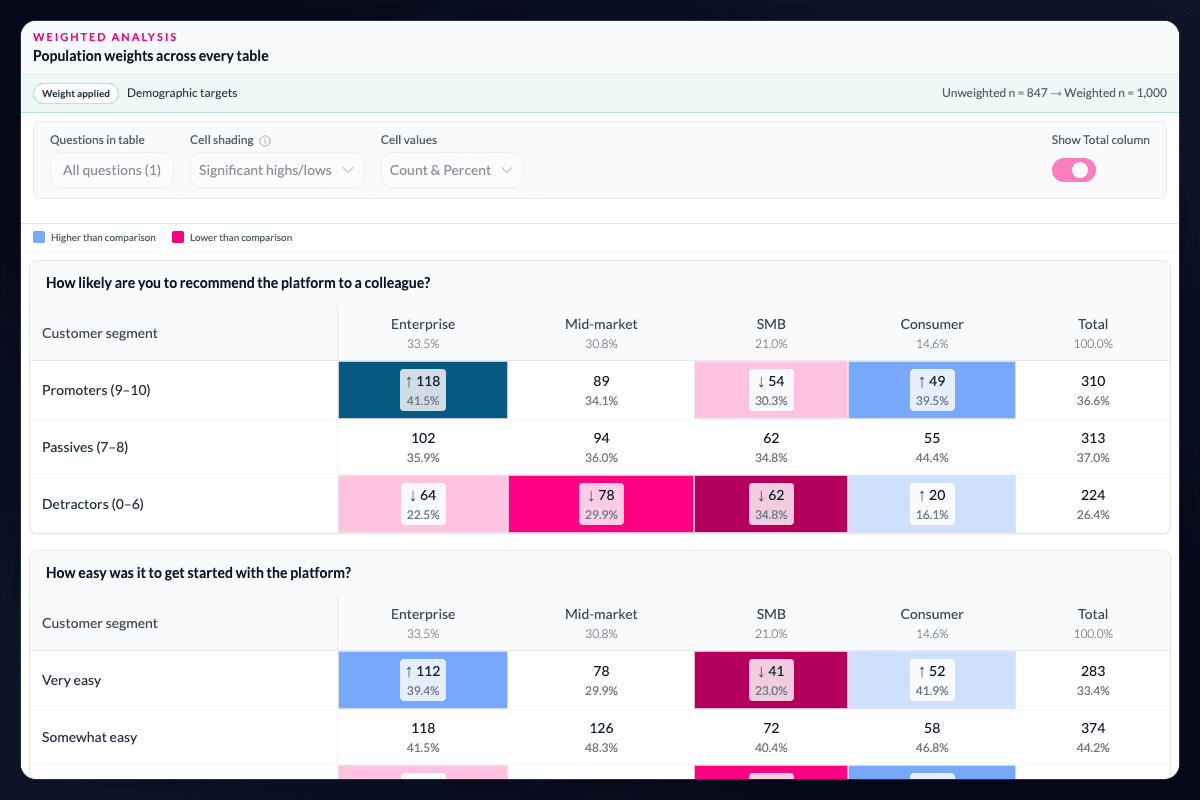
Make every result reflect the intended population.
Import a weight column from SPSS or CSV, or build one from demographic targets in the same project as tabulation and exploration. Apply that definition to tables, banners, and downstream analysis without handing the study to a separate weighting tool.
Use the same weight in every cut.
Weights flow through crosstabs, charts, significance testing, and PowerPoint exports, so the results use one population definition. Toggle weighted and unweighted views to inspect the impact on a key metric before presenting it.
Keep weighting connected to the evidence.
When a weight is maintained separately, it is easy for dozens of banner tables and tracker waves to drift apart. Here, the weighted project continues into tables and delivery with its underlying population definition intact.
Review the effect before sharing the result.
Weighted and unweighted views answer different questions: one describes the achieved sample, while the other is intended to represent the defined population. Comparing both views helps researchers understand how much the weighting changes a metric before using it in a table, chart, or recommendation.
Questions teams ask
Can I import an existing survey weight into AddMaple?
Yes. You can import a weight column from SPSS or CSV and apply it to the project.
Can I build weights from population targets?
AddMaple can build a weight column from demographic targets in the Calculated column wizard.
Where are weights applied?
Weights flow through crosstabs, charts, significance testing, and PowerPoint exports so those outputs use the same population definition.
Read the evidence in context
Results depend on the study design, data quality, bases, weighting, and method settings. AddMaple calculates the statistical outputs; researchers review practical importance and interpretation. An association is not evidence of causation.
How it works
Step-by-step guides in the AddMaple help center.
- Survey weight columns
Build a demographic weight column from target population percentages in the Calculated column wizard — then apply it across tables and tests.
- Weighting
Apply respondent weights to tables, banners, and statistical testing so results reflect the intended population — without a separate tool.
Part of AddMaple's feature areas
This capability sits within broader product areas on the features hub.
- Data preparation & live research data
- Calculated variables & research metrics
Continue exploring
Follow the next step in the workflow or explore a related capability.
- Survey metrics, scores & scalesNPS, CSAT, CES, UMUX, Likert top-box and net scores, composite indices, and reliability measures such as Cronbach's alpha — built in the same project as the analysis.
- Data Table StudioBuild interactive banner tables and ranked crosstabs in-product — significance shading, bases and indices, subgroup ranking, crosstab-level AI, and formatted Excel tab books.
See this capability on a real research workflow.
Bring one study or delivery workflow and we’ll show where AddMaple fits.