


Prepare
Survey-native data structures
Multiple-response questions, Likert scales, categorical and ordinal types, grouped variables, nets, and survey metadata — handled as research data, not generic tables.
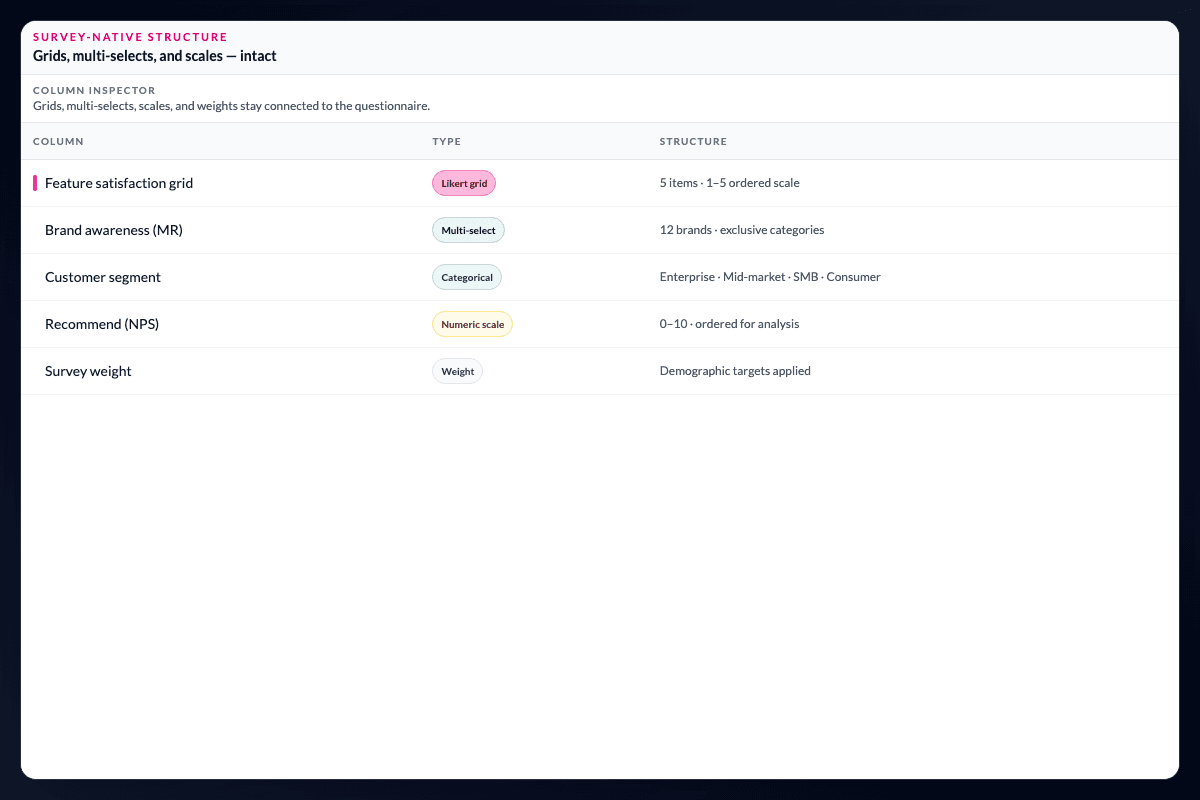
Survey data is more than a flat table.
Multiple-response questions, Likert scales, categorical and ordinal types, grouped variables, nets, and survey metadata are handled as research data. Multi-selects, grids, weights, and multi-wave studies are ready to inspect as the survey structures they are.
Keep the meaning of the questionnaire intact.
AddMaple groups related grid questions, detects multi-select splits, respects value labels from SPSS, and treats opinion scales as ordered data for analysis. Schema files can guide column matching for complex survey exports, while nets and derived groupings stay connected to their source variables.
Let the analysis work the way researchers expect.
Generic spreadsheets break multi-selects, ignore scale order, and force manual relabelling before the work begins. With the structure intact, banners, significance testing, clustering, and key-driver analysis can start from the survey rather than a preprocessing script.
Preserve context for the next analyst.
Survey metadata is part of the evidence, not decoration around it. Keeping labels, grouped questions, and ordered scales together makes the project easier to review and reduces the risk that a later analyst has to infer what a column meant from its values alone. From there, the team can create scores or reshape the data while retaining the original structure.
Questions teams ask
Which survey structures does AddMaple recognise?
AddMaple handles multiple-response questions, multi-selects, grids, Likert and other opinion scales, categorical and ordinal variables, grouped variables, weights, nets, and survey metadata.
Can AddMaple preserve labels from SPSS files?
Yes. AddMaple respects value labels from SPSS and keeps nets and derived groupings connected to their source variables.
Why does survey-native structure matter for analysis?
Preserving structure lets banners, significance testing, clustering, and key-driver analysis work from the meaning of the questionnaire rather than flattened spreadsheet columns.
Read the evidence in context
Results depend on the study design, data quality, bases, weighting, and method settings. AddMaple calculates the statistical outputs; researchers review practical importance and interpretation. An association is not evidence of causation.
How it works
Step-by-step guides in the AddMaple help center.
- Column and variable types
See how AddMaple detects multi-selects, Likert scales, grouped variables, and other survey-native structures — and where to read about each type.
Part of AddMaple's feature areas
This capability sits within broader product areas on the features hub.
- Data preparation & live research data
Continue exploring
Follow the next step in the workflow or explore a related capability.
- Import survey & research dataStart when the file arrives — import Qualtrics, Decipher, Alchemer, SPSS, Excel, CSV, live connectors, SharePoint, and governed enterprise data sources without a separate processing step.
- Survey metrics, scores & scalesNPS, CSAT, CES, UMUX, Likert top-box and net scores, composite indices, and reliability measures such as Cronbach's alpha — built in the same project as the analysis.
See this capability on a real research workflow.
Bring one study or delivery workflow and we’ll show where AddMaple fits.