


Prepare
Filters & saved segments
Filter by response, save audiences and segments, and build banner categories — reusable across tables, charts, and exports.
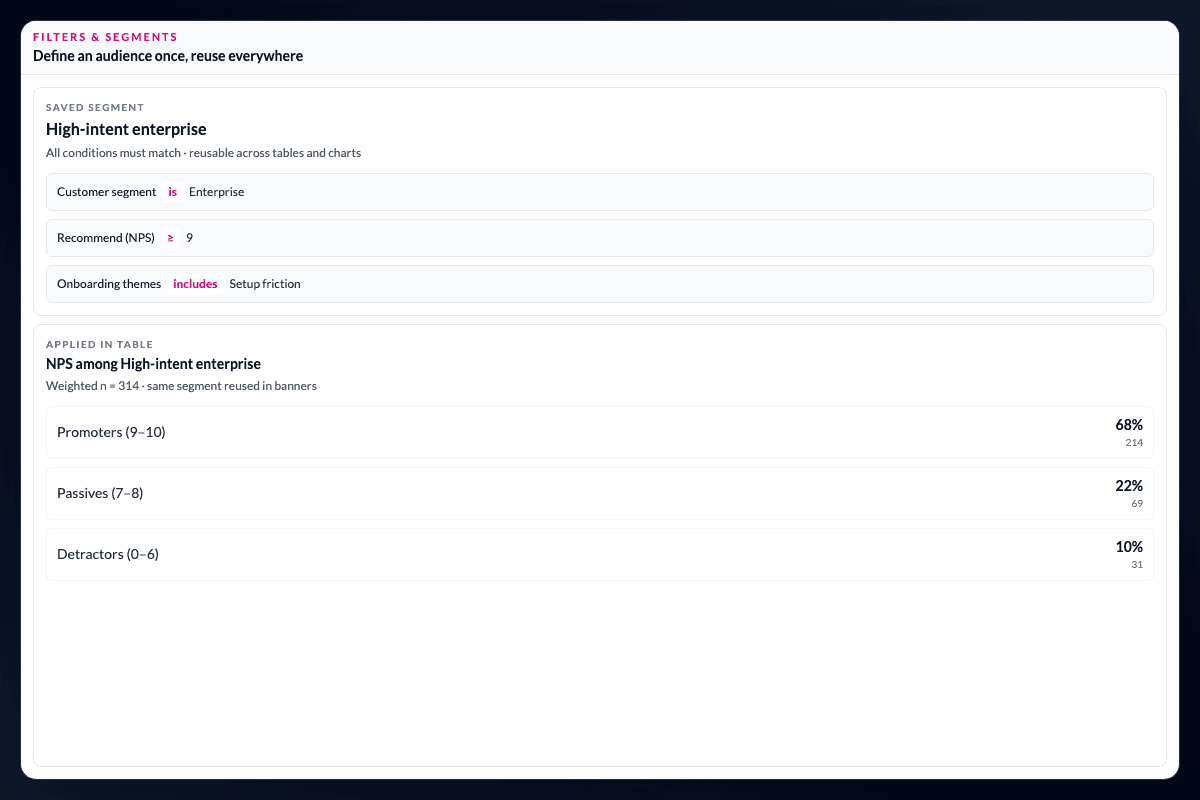
Define an audience once. Reuse it everywhere.
Filter by response, save audiences and segments, and build banner categories that work across tables, charts, and exports. Researcher-defined if-then segments sit alongside data-led clustering outputs in the same project.
Build the cut the question calls for.
Use flexible operators across demographics, behaviours, coded text themes, and survey responses. Combine filters for complex audience definitions without rebuilding the logic for each table.
Let the segment travel with the analysis.
Saved segments persist as project columns: use them as banner variables, chart filters, clustering exclusions, or Insight Hub explorable dimensions. That makes follow-up cuts comparable and defensible instead of a fresh audience definition each time.
Make an audience definition part of the project.
The useful asset is not only the first filtered table. It is the definition behind it: who was included, which conditions were combined, and whether the audience should be exclusive or overlapping. Keeping that logic in the project gives analysts a repeatable basis for subsequent cuts and gives stakeholders a clearer explanation of who a result represents.
Questions teams ask
What can I use to define a saved segment?
Saved segments can use flexible conditions across demographics, behaviours, coded text themes, and survey responses, with multiple filters combined into one audience definition.
Can a segment be used in more than one table or chart?
Yes. Saved segments persist as project columns and can be reused in banners, chart filters, clustering exclusions, and Insight Hub dimensions.
Are saved segments the same as data-led clusters?
No. Researcher-defined if-then segments and data-led clustering outputs are distinct, but both can be used in the same project analysis.
Read the evidence in context
Results depend on the study design, data quality, bases, weighting, and method settings. AddMaple calculates the statistical outputs; researchers review practical importance and interpretation. An association is not evidence of causation.
How it works
Step-by-step guides in the AddMaple help center.
- Subgroup views
Build and share focused audience views using filters, segments, and pivots, then reuse them across tables, charts, and client deliverables.
- Create custom segments
Define if-then segments with flexible operators across demographics, behaviors, and survey responses — exclusive or overlapping per row.
Part of AddMaple's feature areas
This capability sits within broader product areas on the features hub.
- Tables, banners & significance
- Segmentation & advanced analysis
Continue exploring
Follow the next step in the workflow or explore a related capability.
- Data Table StudioBuild interactive banner tables and ranked crosstabs in-product — significance shading, bases and indices, subgroup ranking, crosstab-level AI, and formatted Excel tab books.
- Segmentation & clusteringWhich groups actually exist in this audience? Compare clustering approaches suited to numeric, categorical, or mixed survey data, then profile the groups you can use.
See this capability on a real research workflow.
Bring one study or delivery workflow and we’ll show where AddMaple fits.