


Prepare
Survey metrics, scores & scales
NPS, CSAT, CES, UMUX, Likert top-box and net scores, composite indices, and reliability measures such as Cronbach's alpha — built in the same project as the analysis.
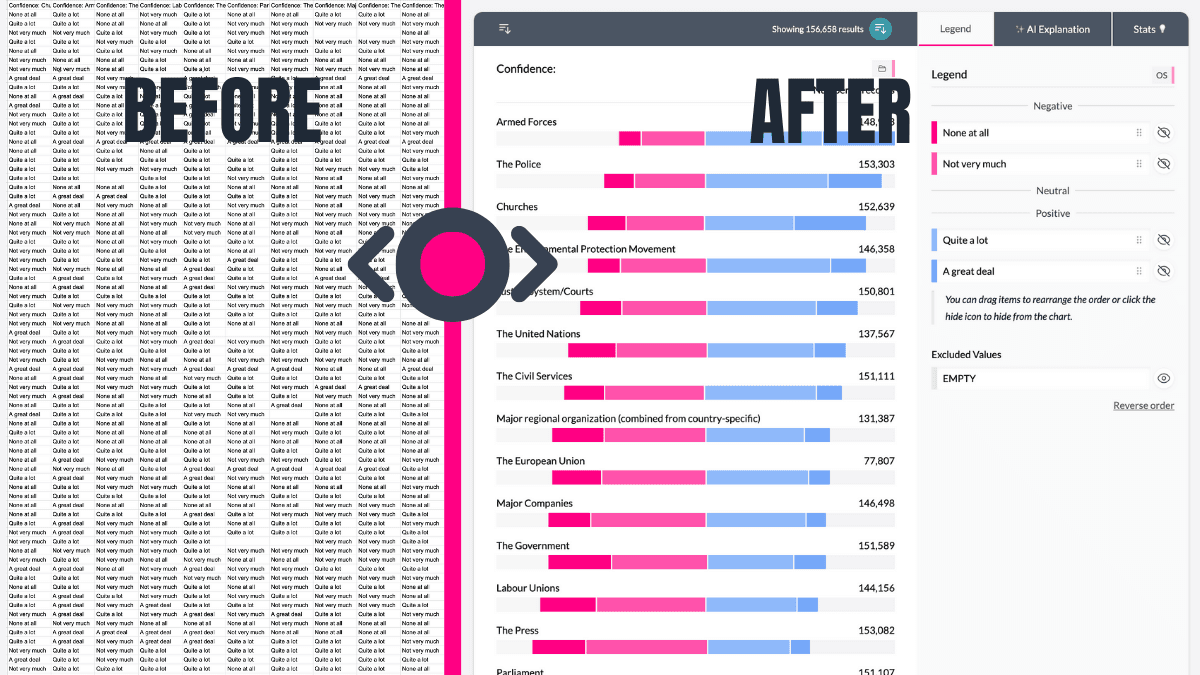
Build the measures the study needs.
Create NPS, CSAT, CES, UMUX-2, UMUX-4, Likert top-box and net scores, composite indices, and custom formulas in the same project as the analysis. Text operations and calculated columns stay tied to the dataset rather than a separate spreadsheet.
Check a scale before you model it.
Reliability measures such as Cronbach's alpha help validate multi-item scales before they enter segmentation or driver models. In trackers, calculated columns update as source data refreshes.
One definition follows the work through.
The same score can appear in banners, significance testing, key-driver analysis, clustering, charts, and exports. That keeps every analyst, chart, table, and Insight Hub working from one definition—not a new calculation for every cut.
Make the measure part of the research record.
A score is often the measure stakeholders remember, but its construction is what analysts need to defend. Keeping the formula, component items, and reliability check in the project gives the team a shared definition to inspect before it becomes a headline, a segment input, or a recurring tracker metric.
Questions teams ask
Which standard survey measures can AddMaple create?
AddMaple supports NPS, CSAT, CES, UMUX-2, UMUX-4, Likert top-box and net scores, composite indices, and custom calculated measures.
Can I create a custom score rather than use a standard metric?
Yes. Custom formulas and text operations can be built as calculated columns tied to the project dataset.
How can I check whether a multi-item scale is reliable?
AddMaple provides reliability measures such as Cronbach's alpha to help assess a multi-item scale before using it in further analysis.
Read the evidence in context
Results depend on the study design, data quality, bases, weighting, and method settings. AddMaple calculates the statistical outputs; researchers review practical importance and interpretation. An association is not evidence of causation.
How it works
Step-by-step guides in the AddMaple help center.
- Survey score columns
Create NPS, CSAT, CES, and UMUX calculated columns from scale questions — ready for banners, drivers, and exports.
- Custom formula columns
Build numeric calculated columns with SQL-like formulas — arithmetic, CASE, window aggregates, and inferred column dependencies.
- Numeric factors
Combine multiple columns into composite numeric scores with Cronbach's alpha reliability preview.
Part of AddMaple's feature areas
This capability sits within broader product areas on the features hub.
- Calculated variables & research metrics
Continue exploring
Follow the next step in the workflow or explore a related capability.
- Weighted analysisApply survey weights to tables, banners, and analysis so results reflect the intended population — without exporting to a separate weighting tool.
- Statistical testing & significanceWhich differences are evidence, not noise? Named tests, effect sizes, and multiple-comparison correction — selected by variable type, with inspectable results.
See this capability on a real research workflow.
Bring one study or delivery workflow and we’ll show where AddMaple fits.