Add Maple
← AddMaple Mosaic

Story Dashboard showcase

Research worth exploring.Stories that stay connected.

A clear narrative is just the beginning. These Story Dashboards bring the evidence with them — live charts, explorable comparisons and the freedom to ask your own questions. All four are coming soon.

Four studies. Opening soon.

Previews of the stories. The live dashboards are not public yet.

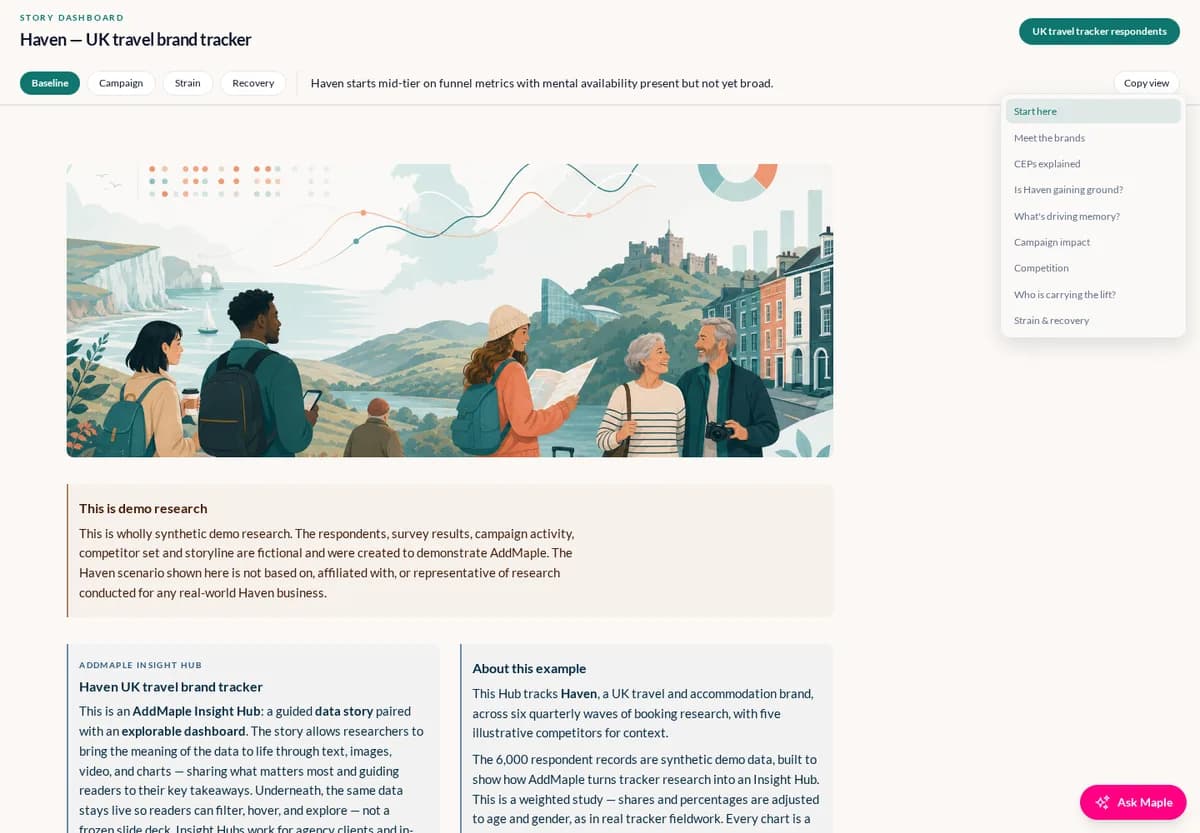
  • Haven brand tracker with phase lenses and an illustrated UK travel story

    Coming soon

    Brand tracking

    Haven

    The story behind the brand’s momentum.

    Follow a UK travel brand through six waves of research. Explore mental availability, campaign impact, competitive context and the experience risks beneath the growth.

    • Wave comparisons
    • Audience filters
    • Mental availability

    Synthetic demo research · Not research conducted for or affiliated with Haven

    Coming soon
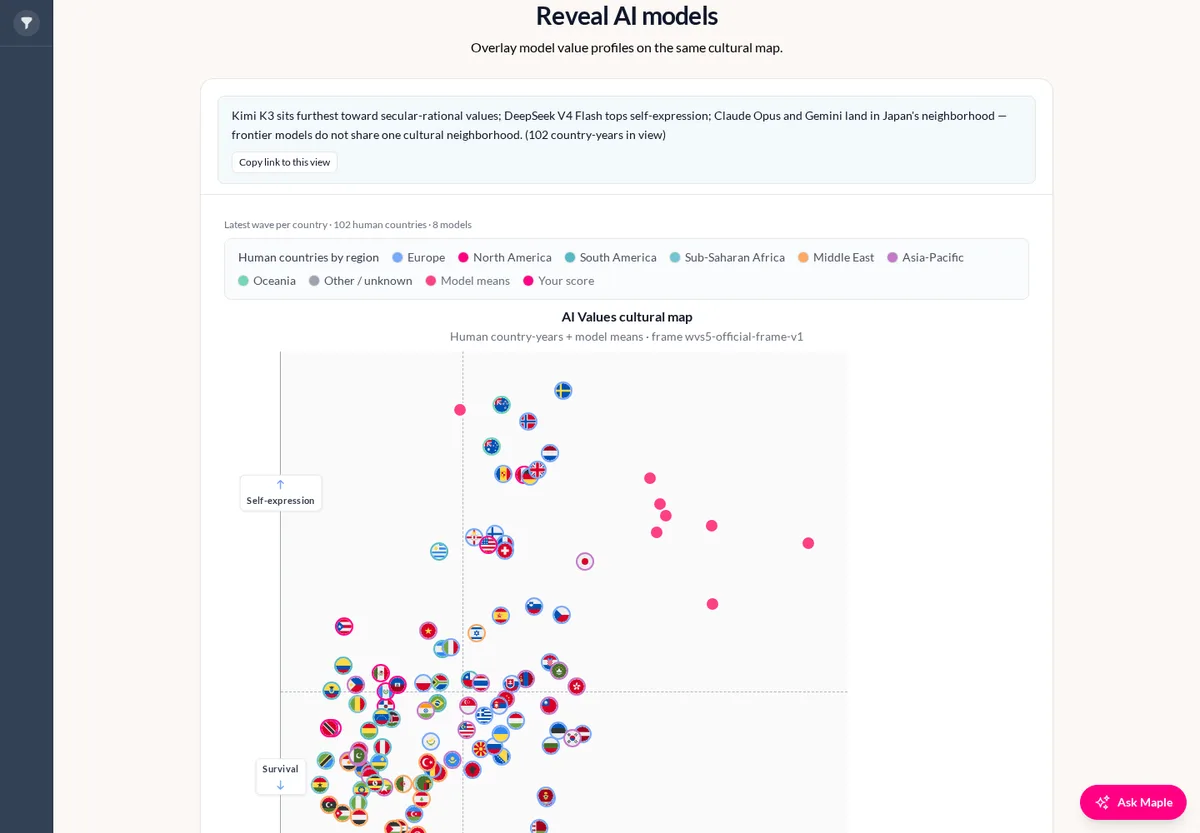
  • AI Values cultural map showing human country flags alongside AI model profiles

    Coming soon

    AI & culture

    AI Values

    Where do AI models sit on the cultural map?

    Compare elicited AI model response profiles with human societies on the Inglehart–Welzel cultural map. Explore the differences between traditional, secular-rational, survival and self-expression values.

    • Interactive cultural map
    • Model comparisons
    • Guided lenses

    World Values Survey + European Values Study · Elicited AI response profiles

    Coming soon

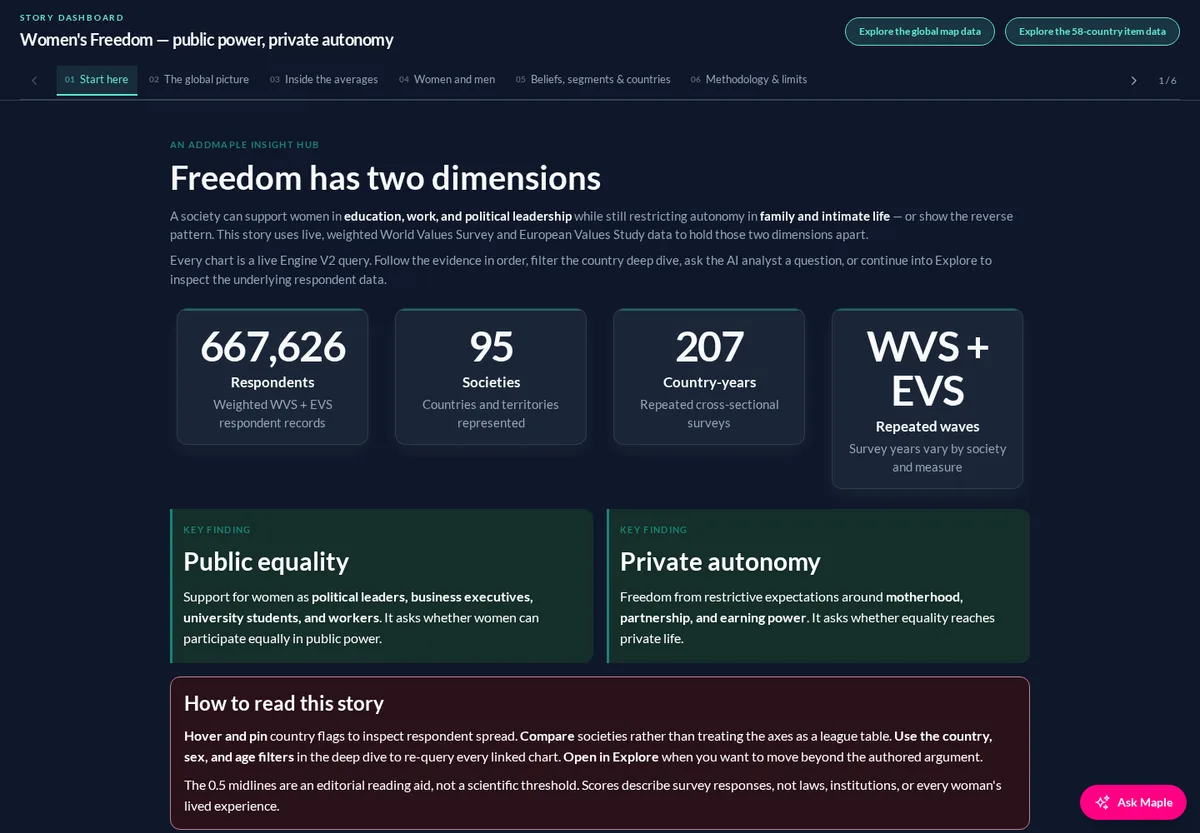
  • Women’s Freedom dashboard introducing public equality and private autonomy

    Coming soon

    Society & equality

    Women’s Freedom

    Public power. Private autonomy. Two different stories.

    Explore how support for women’s equality in public life relates to autonomy in private life. Go beyond national averages with respondent distributions, women–men comparisons and country deep dives.

    • Country comparisons
    • Respondent distributions
    • Country deep dives

    World Values Survey + European Values Study · Weighted survey responses

    Coming soon

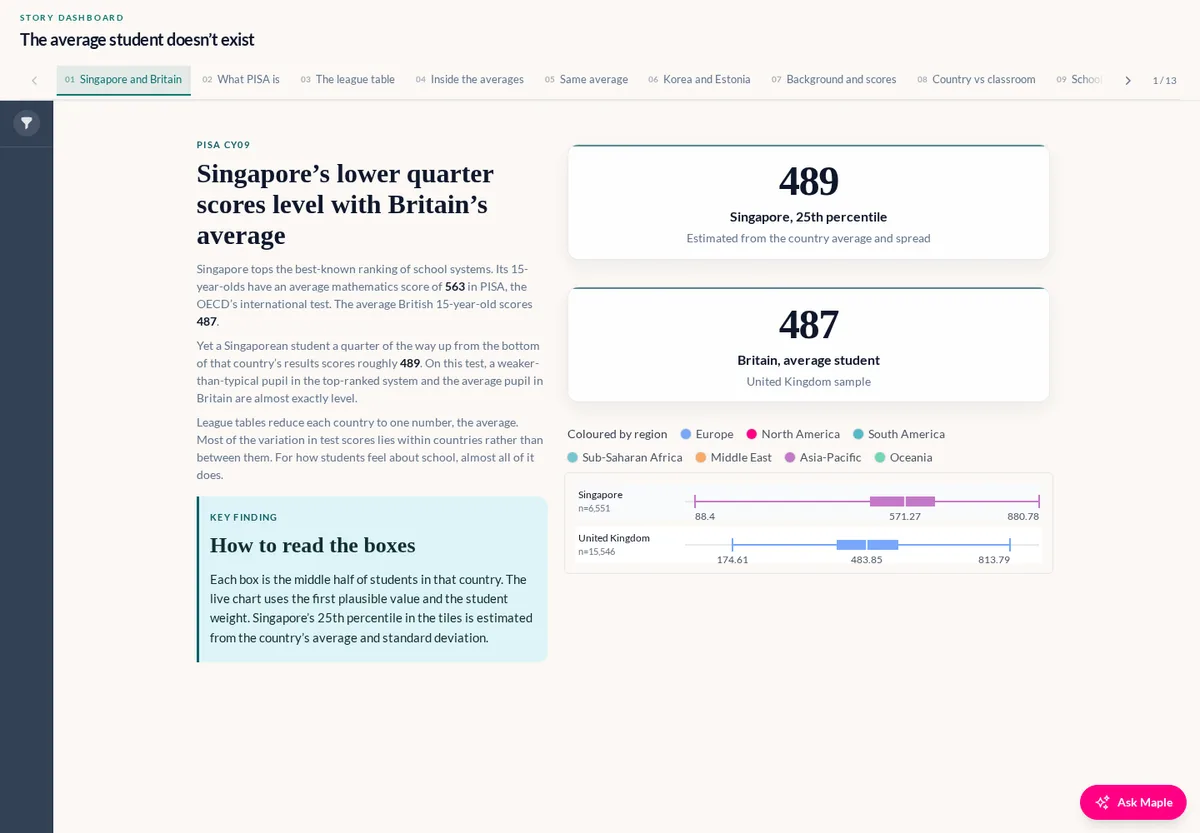
  • PISA dashboard comparing Singapore and Britain with score tiles and live box plots

    Coming soon

    Education & opportunity

    PISA

    The average student doesn’t exist.

    Look beyond the school-system league table. Explore the spread of mathematics scores within countries, then investigate family background, school AI use and students’ sense of belonging.

    • Score distributions
    • Country comparisons
    • Student filters

    OECD PISA · International student assessment and questionnaire data

    Coming soon

Previews are screenshots. The live dashboards are coming soon.

Your research, connected

Give your next study a life beyond the debrief.

Turn the charts and insights in your AddMaple project into a Story Dashboard. Guide your audience through what matters, then let them explore the evidence behind it.