


Discover
Statistical testing & significance
Which differences are evidence, not noise? Named tests, effect sizes, and multiple-comparison correction — selected by variable type, with inspectable results.
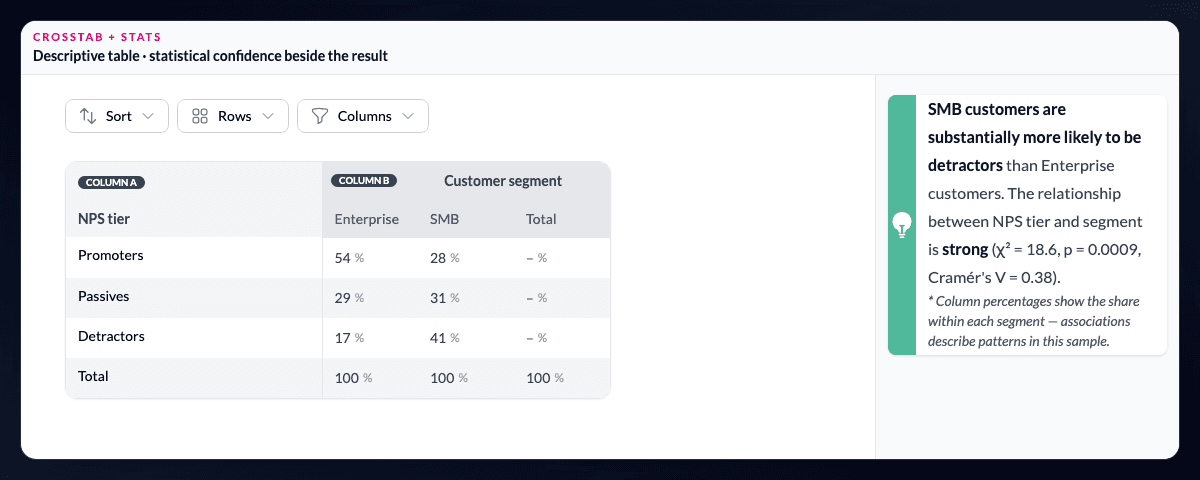
Which differences are evidence, not noise?
AddMaple selects from supported chi-square, proportion and z tests, t-tests, ANOVA, non-parametric tests, and correlation based on the types of columns being compared.
The right test is selected from the data in front of you.
Significance letters and Holm-adjusted p-values appear in tabulation workflows. Pivot charts show a Stats Overview card with colour-coded strength and plain-English interpretation, while banner tables use z-score shading to reveal the cells performing above or below expectation.
See the size of the difference, not just the p-value.
Toggle detailed calculations to inspect p-values, effect sizes such as Cramér's V and Cohen's d, correlation coefficients, and category-level breakdowns. Named methods and inspectable outputs keep the evidence reviewable when a result needs to stand up in a client-facing deliverable.
Keep statistical significance in proportion.
A significant result is a prompt for interpretation, not a substitute for it. Researchers still consider bases, weighting, study design, effect size, and practical importance before deciding what belongs in the story. Exposing the method and calculation makes that review possible before a difference becomes a recommendation.
Questions teams ask
Which statistical tests does AddMaple support?
Supported methods include chi-square, proportion and z tests, t-tests, ANOVA, non-parametric tests, correlation, and multiple-comparison correction.
How does AddMaple choose a test?
AddMaple selects from supported tests based on the types of the columns being compared.
Can I inspect more than statistical significance?
Yes. Detailed calculations include p-values, effect sizes such as Cramér's V and Cohen's d, correlation coefficients, and category-level breakdowns.
Read the evidence in context
Results depend on the study design, data quality, bases, weighting, and method settings. AddMaple calculates the statistical outputs; researchers review practical importance and interpretation. An association is not evidence of causation.
How it works
Step-by-step guides in the AddMaple help center.
- Significance Testing
Turn on significance shading in tables, read z-score tiers and Holm-adjusted p-values, and focus on segment differences worth sharing with clients.
- Run significance testing and read the shading
Walk through enabling significance in pivot tables and interpreting what the color shading means for stakeholder-facing cuts.
Part of AddMaple's feature areas
This capability sits within broader product areas on the features hub.
- Tables, banners & significance
- Key drivers, regression & relationships
Continue exploring
Follow the next step in the workflow or explore a related capability.
- Ranked subgroup differencesIn Data Table Studio, surface which questions differ most across a banner first — ranked by statistical strength, including quant variables and AI-coded themes.
- Regression, PCA & multivariate modellingWhat is the estimated relationship — and what structure sits behind the batteries? Linear and logistic regression with fitted charts, Elastic Net multivariate key-driver models, and PCA with optional Varimax rotation.
See this capability on a real research workflow.
Bring one study or delivery workflow and we’ll show where AddMaple fits.