


Discover
Tracker trends & wave comparison
Compare waves, track movement in key metrics over time, and analyze longitudinal tracker data in the same project as cross-sectional cuts.
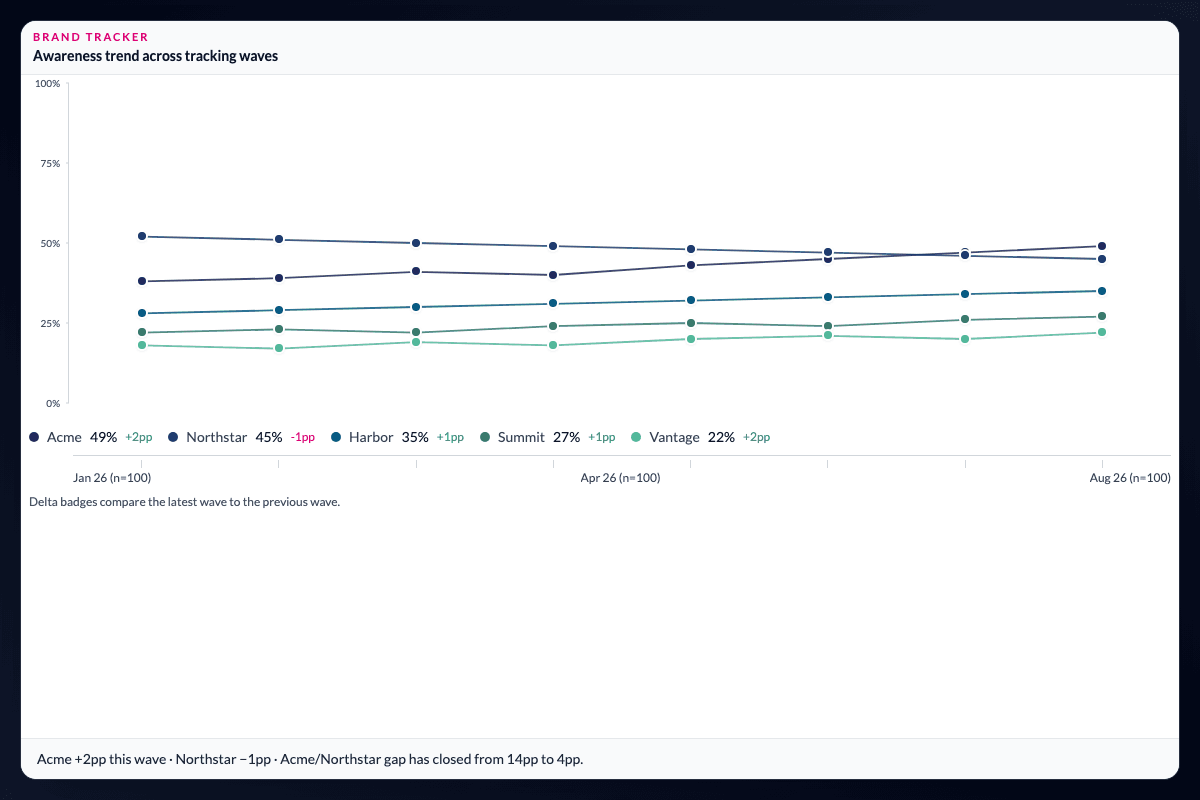
How are the metrics moving across waves?
Compare waves, track movement in key metrics over time, and analyse longitudinal tracker data in the same project as cross-sectional cuts. Multi-wave alignment carries forward as new data is refreshed.
Use the same definitions for trends and point-in-time cuts.
Plot NPS, satisfaction, awareness, and custom metrics across waves. Compare movement with the same filters, weights, and segments used for banners, so a trend and a cross-sectional result remain part of one evidence base.
See what changed—and for whom.
Significance testing and ranked differences work on tracker cuts, helping analysts identify the metrics that moved and the subgroups behind the change. Live tracker preparation leads straight into this analysis instead of creating a new wave snapshot to reconcile.
Separate a movement in the data from a change in the workflow.
Longitudinal evidence is only useful when the definitions remain comparable. Keeping wave alignment, measures, filters, weights, and segments together gives the analyst a basis for deciding whether a change reflects respondents, the population definition, the questionnaire, or the way the data was prepared.
Questions teams ask
What can I compare across tracker waves?
You can plot NPS, satisfaction, awareness, and custom metrics across waves, then compare movement using the same filters, weights, and segments as point-in-time cuts.
Can I test whether a tracker metric changed?
Significance testing and ranked differences work on tracker cuts, helping identify which movements and subgroup differences deserve investigation.
Does wave analysis use a separate project?
No. Tracker trends and wave comparisons stay in the same aligned project as the underlying preparation and cross-sectional analysis.
Read the evidence in context
Results depend on the study design, data quality, bases, weighting, and method settings. AddMaple calculates the statistical outputs; researchers review practical importance and interpretation. An association is not evidence of causation.
How it works
Step-by-step guides in the AddMaple help center.
- Analyzing tracker studies
Compare waves, track movement in key metrics over time, and analyze longitudinal tracker data alongside cross-sectional cuts in one project.
Part of AddMaple's feature areas
This capability sits within broader product areas on the features hub.
- Data preparation & live research data
- Tables, banners & significance
Continue exploring
Follow the next step in the workflow or explore a related capability.
See this capability on a real research workflow.
Bring one study or delivery workflow and we’ll show where AddMaple fits.