


Deliver
Charts, presentations & exports
Editable PowerPoint charts, tables, and data exports — move from finding to stakeholder deliverables without rekeying.
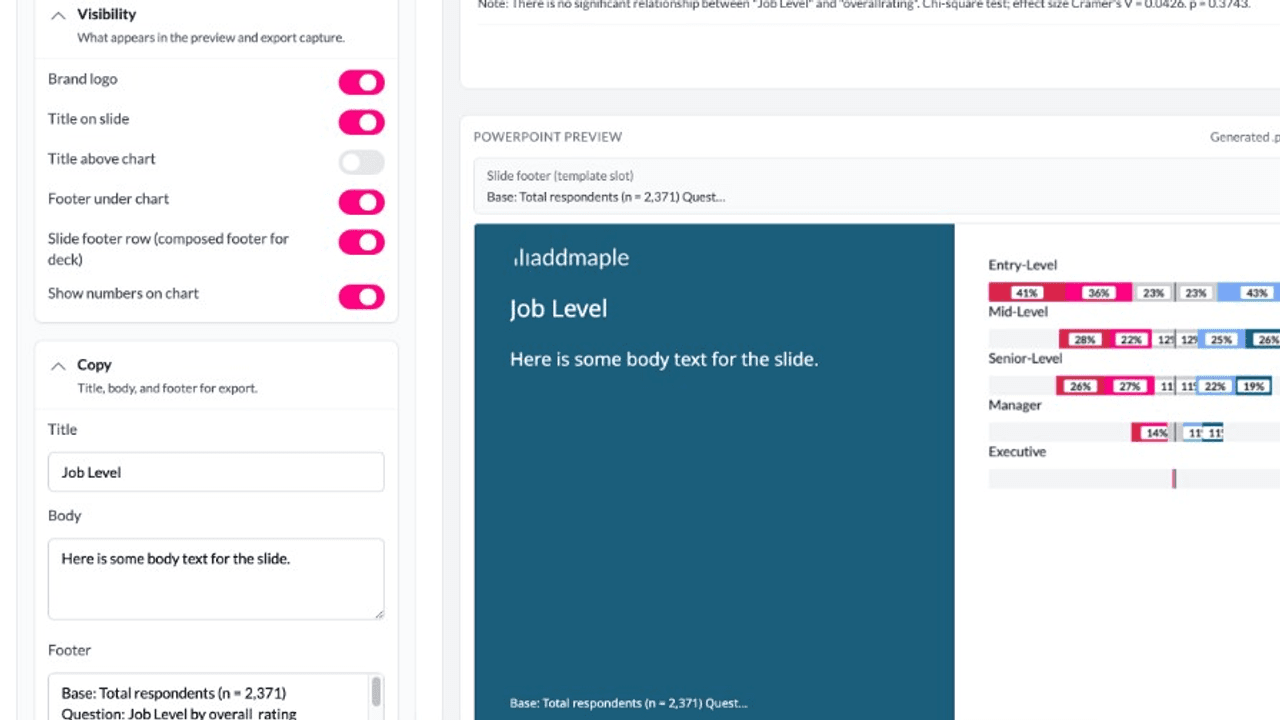
When the readout is tomorrow, the deck cannot start from scratch.
Move from finding to stakeholder deliverables with editable PowerPoint charts, tables, and data exports—without rekeying. Export selected charts from My Collection or the Selection menu; slides follow project colour presets and respect survey weights when applied.
Carry the analysis into the output.
Switch chart types and count/percentage views from the same underlying analysis. Likert scales, histograms, word frequency, and significance-marked subgroup comparisons render in default chart views. Save findings to Insights for reuse across dashboards and exports.
Re-export when the cut changes.
When the underlying cut changes, re-export the updated chart without rebuilding it. The same evidence can also become part of a Story Dashboard or Insight Hub when stakeholders need more than a presentation file.
Keep the deliverable editable enough for the work around it.
Research outputs rarely stop when the file is downloaded. Teams add annotations, apply client templates, combine findings, and prepare a readout for a particular audience. Exporting from the live analysis gives them a presentation starting point that remains tied to the project’s definitions, rather than a screenshot whose values must be checked and re-entered by hand.
Questions teams ask
Can I export AddMaple charts to PowerPoint?
Yes. Selected charts and tables can be exported from My Collection or the Selection menu as PowerPoint files without rekeying the values.
Do exported outputs reflect the analysis settings?
Charts use the project’s colour presets and respect survey weights when applied; count and percentage views can be switched from the underlying analysis.
What happens if the analysis cut changes?
Re-export the updated chart from the same analysis rather than rebuilding the finding in a presentation file.
How it works
Step-by-step guides in the AddMaple help center.
- Export charts to PowerPoint
Download selected charts and tables from My Collection or the Selection menu as an editable PowerPoint file — without rekeying values.
- Turn findings into stakeholder outputs
Move from analysis to stakeholder deliverables with PowerPoint export, dashboards, Insights, and publishing options in one workflow.
Part of AddMaple's feature areas
This capability sits within broader product areas on the features hub.
- Charts, presentations & exports
Continue exploring
Follow the next step in the workflow or explore a related capability.
- Story Dashboards & Insight HubsBuild page-based Story Dashboards in the product, then publish controlled, explorable Insight Hubs that clients and stakeholders keep using after the debrief.
- Embed & share outputsShare chart links in Slack and email, or embed approved outputs in tools such as Notion and websites — distribute findings where teams already work without rebuilding slides.
See this capability on a real research workflow.
Bring one study or delivery workflow and we’ll show where AddMaple fits.