Open sidebar
AddMaple
Use Cases
Features
Case Studies
Pricing
Resources
Sign In
Assistant
Contents
Get Started
Prepare Your Data
Explore and Visualize
Searching for columns
Chart gallery
Single Column Horizontal Bar Chart
Grouping Columns
Understanding the row by row view
How to aggregate by another column
Sorting table columns
Use Analysis Agent
Editing column titles and types
Two Column Horizontal Stacked Bar Chart
Exploring your data
Adding a filter from the row view
Adding a pivot
Adding and removing columns in the table view
How to encrypt and decrypt columns
Three Column Grouped Stacked Horizontal Bar Chart
Editing a Category
Navigating between rows
Adding a Filter
Adding a filter from the table view
Likert Chart
Subgroup views
AI Powered Chart Explanations
How to remove the long tail
Exploring a single row
Single Box Plot
Grouped Box Plot
Single Column Vertical Bar Chart
Filtering vs Hiding in Pivot Charts
Two Column Vertical Stacked Bar Chart
Use Filter Types
Understanding Percentage Types
Pie, Donut, and Rose Charts
Two Column Line / Trend Chart
Single Column Pie Chart
Geographic Chart
Single Column Donut Chart
Scatter Plot
Single Column Rose Chart
Single Column Bubble Chart
Additional Charts
Time Charts
Dot Charts
Box Plots and Mean Dot Plots
AI Powered Chart Explanations
Charts Overview
Run Statistical Analysis
Analyze Open Text
Build Deliverables
Share With Clients or Teams
Connect Data Sources
FAQs and Trust
← All help articles
A visual reference for all chart types in AddMaple. Click any thumbnail to open the full guide.
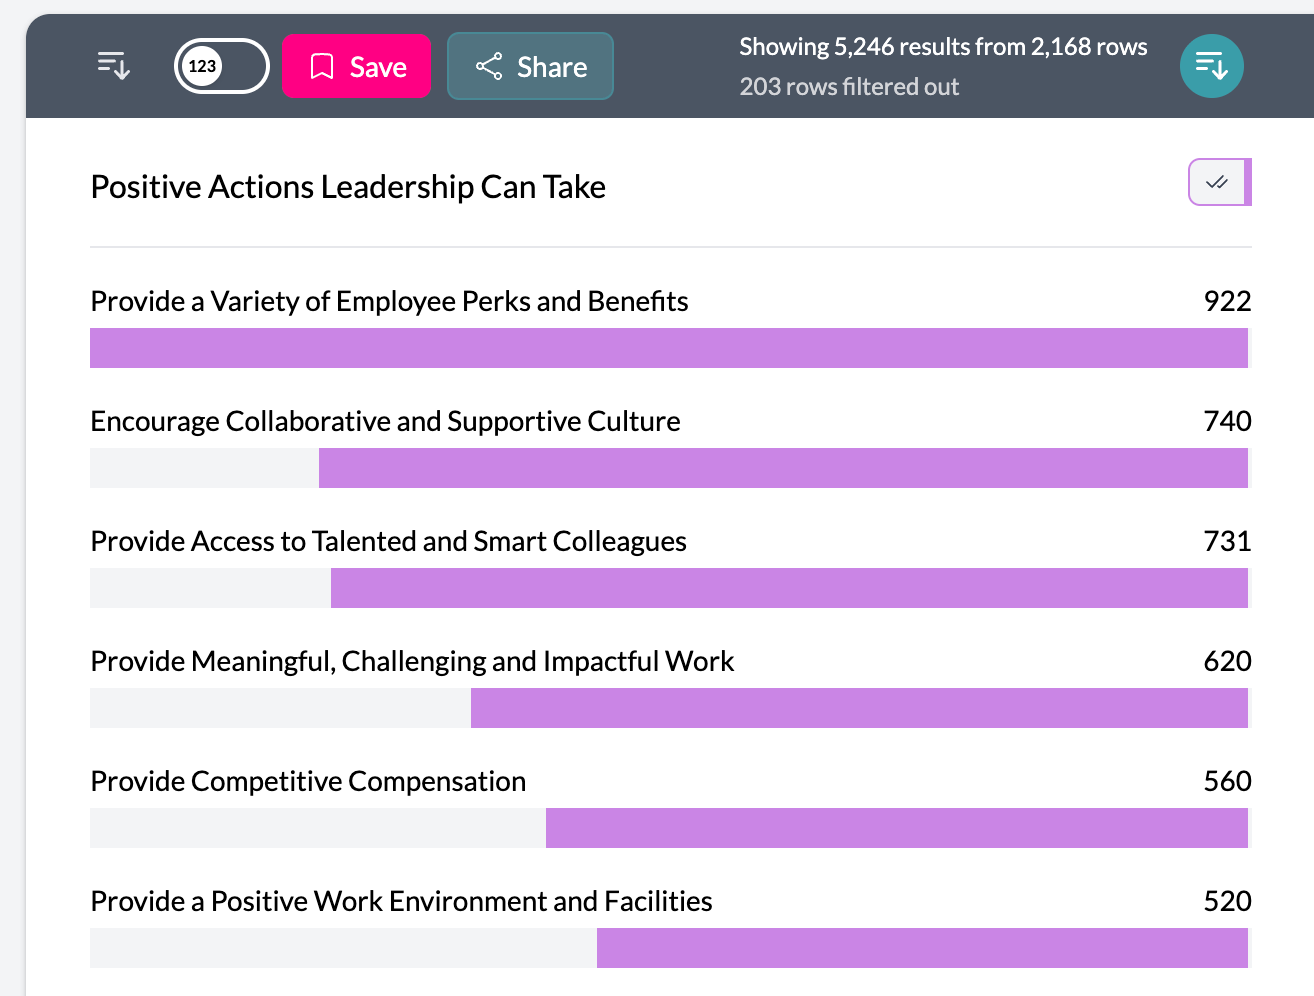
Single column horizontal bar
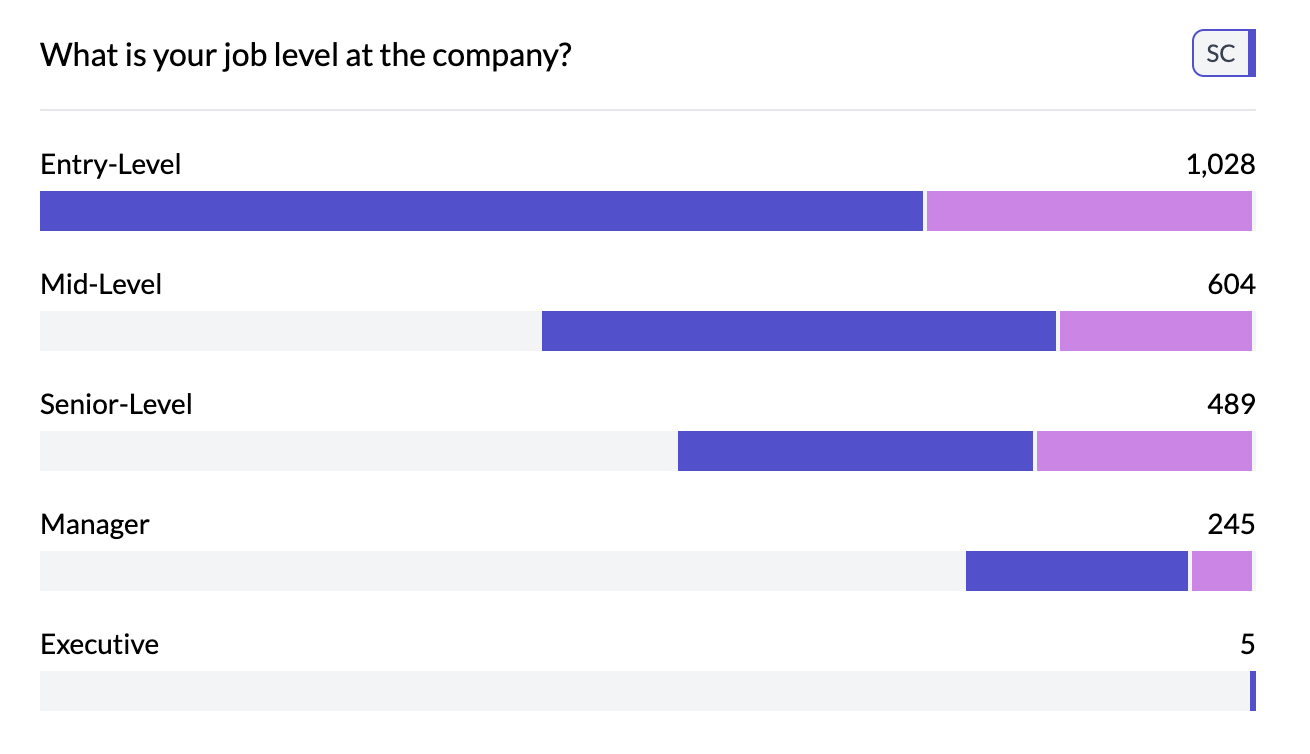
Two column horizontal stacked bar
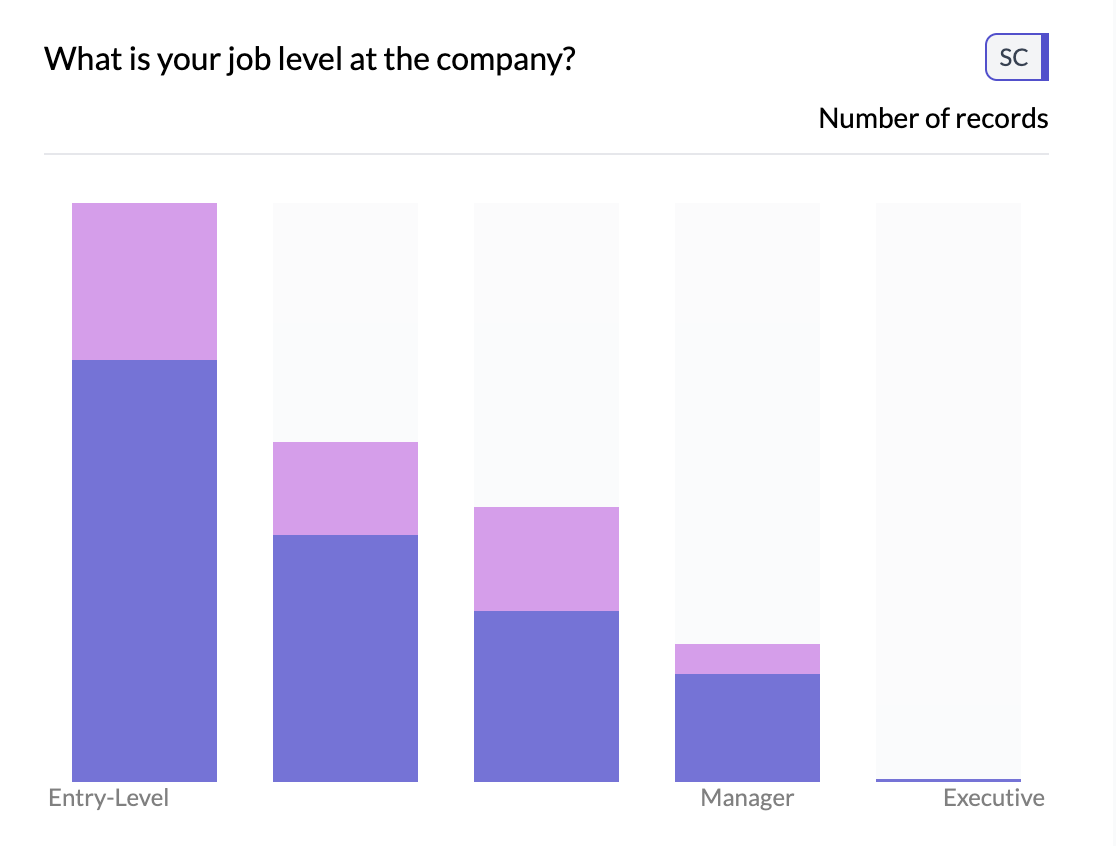
Two column vertical stacked bar
Single column vertical bar
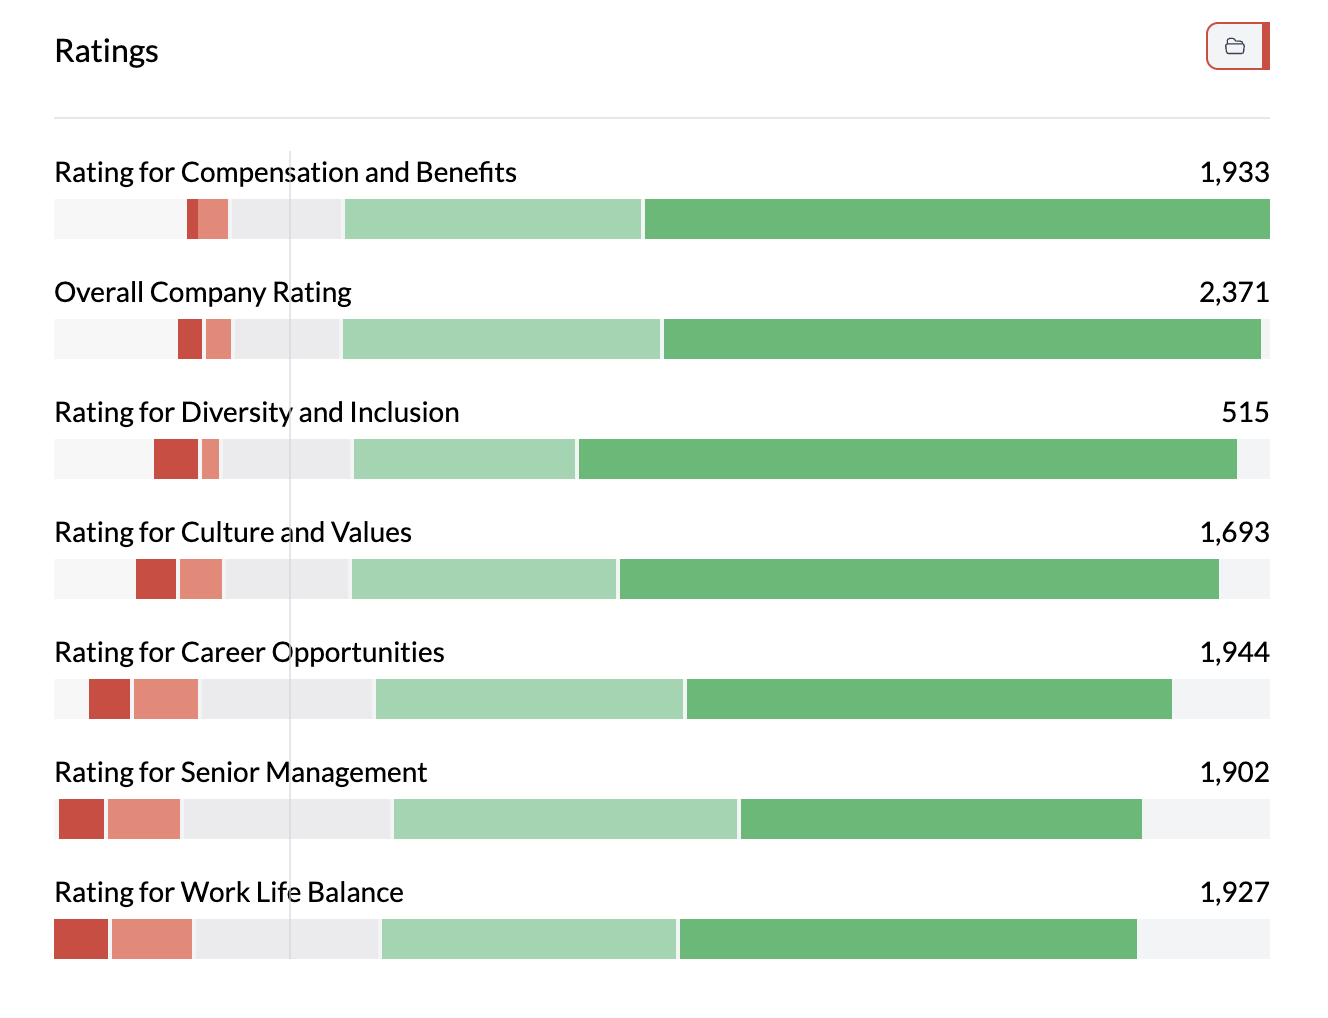
Likert chart
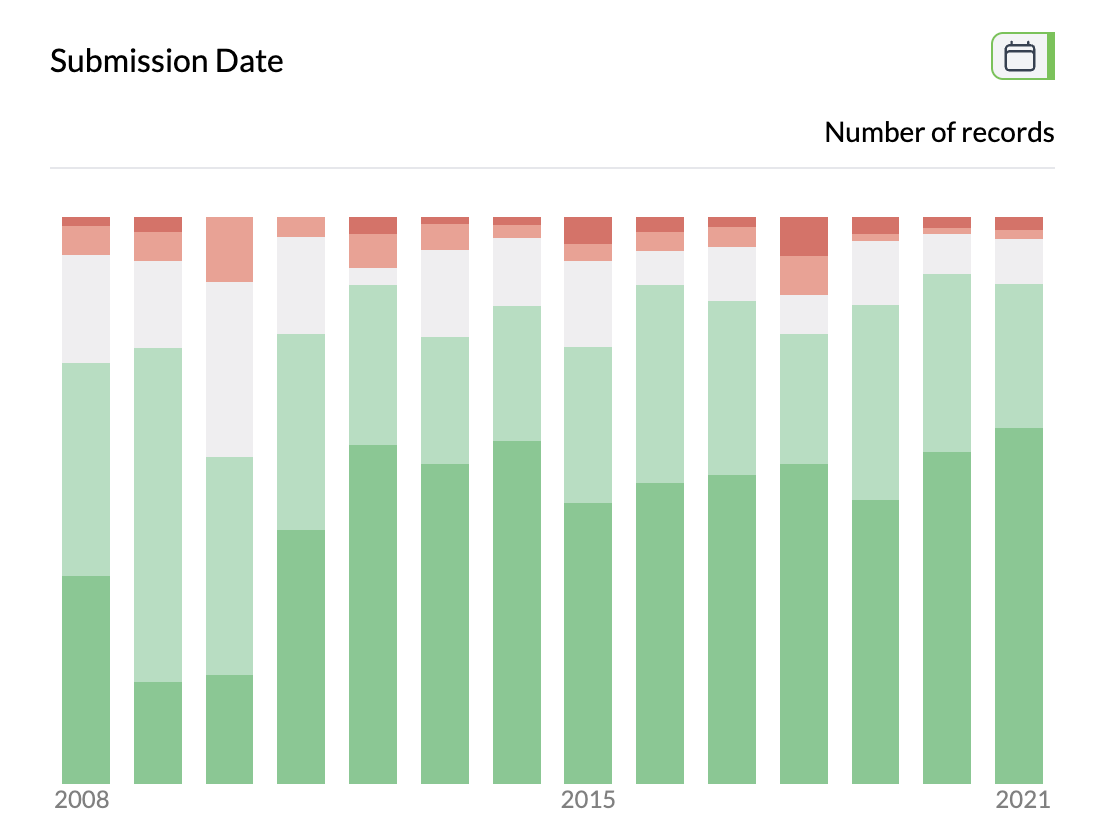
Two column line / trend chart
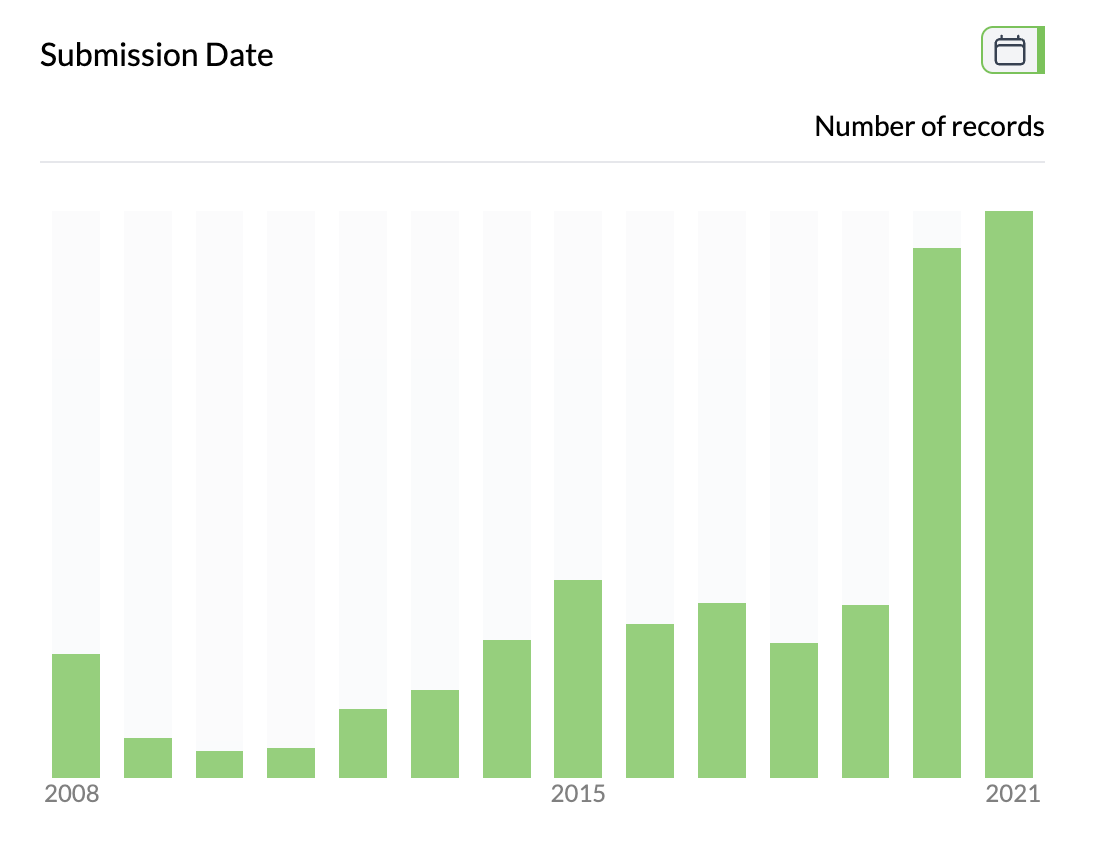
Time chart
Single box plot
Grouped box plot
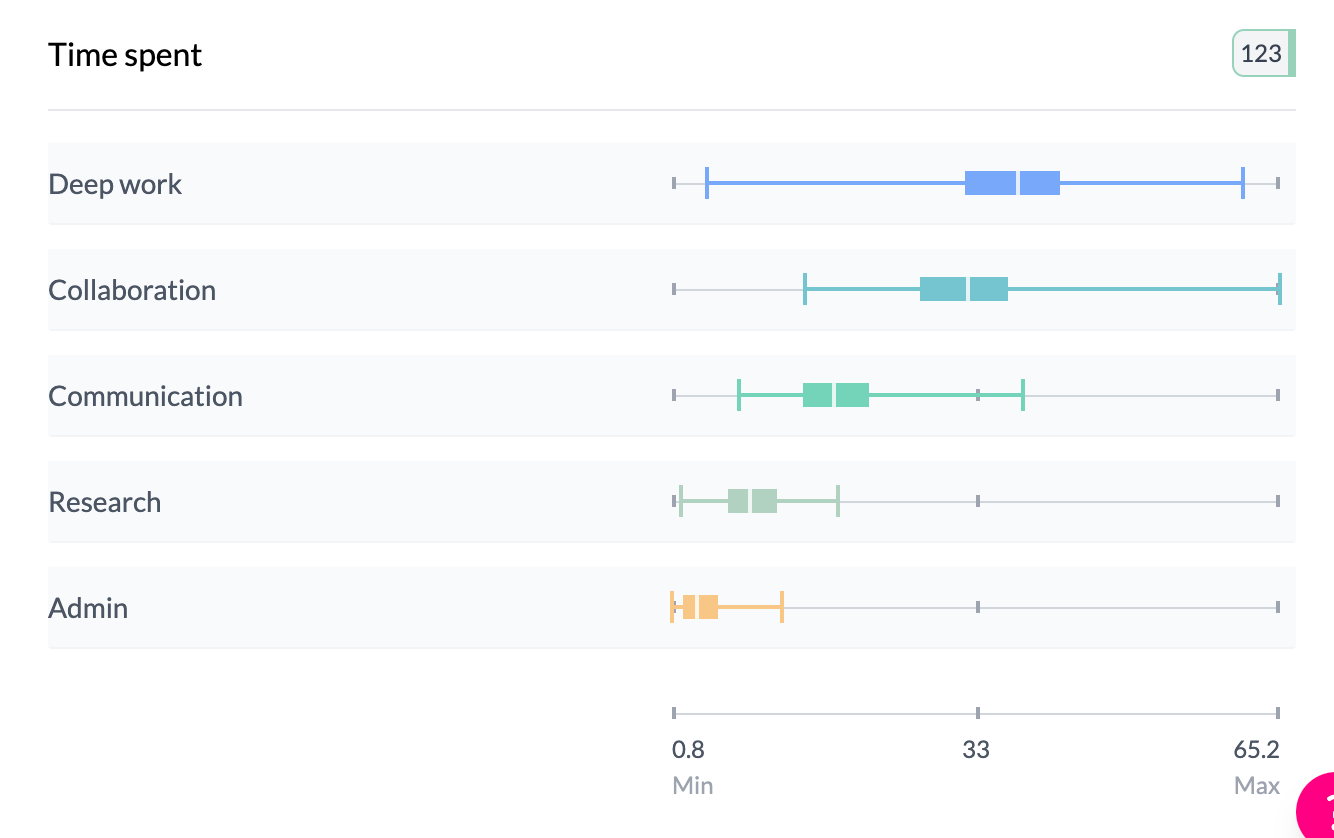
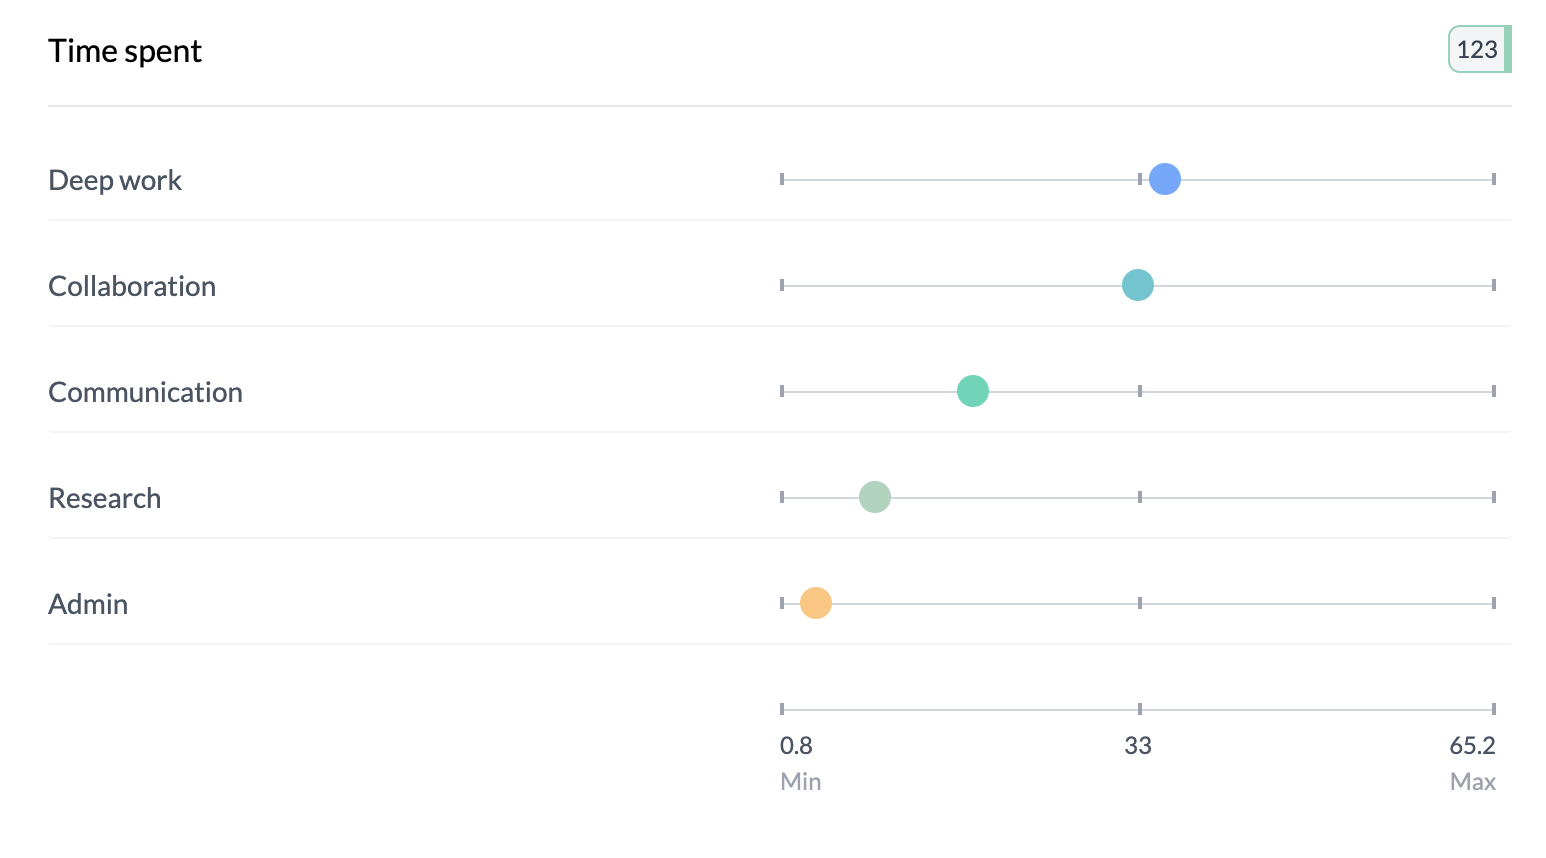
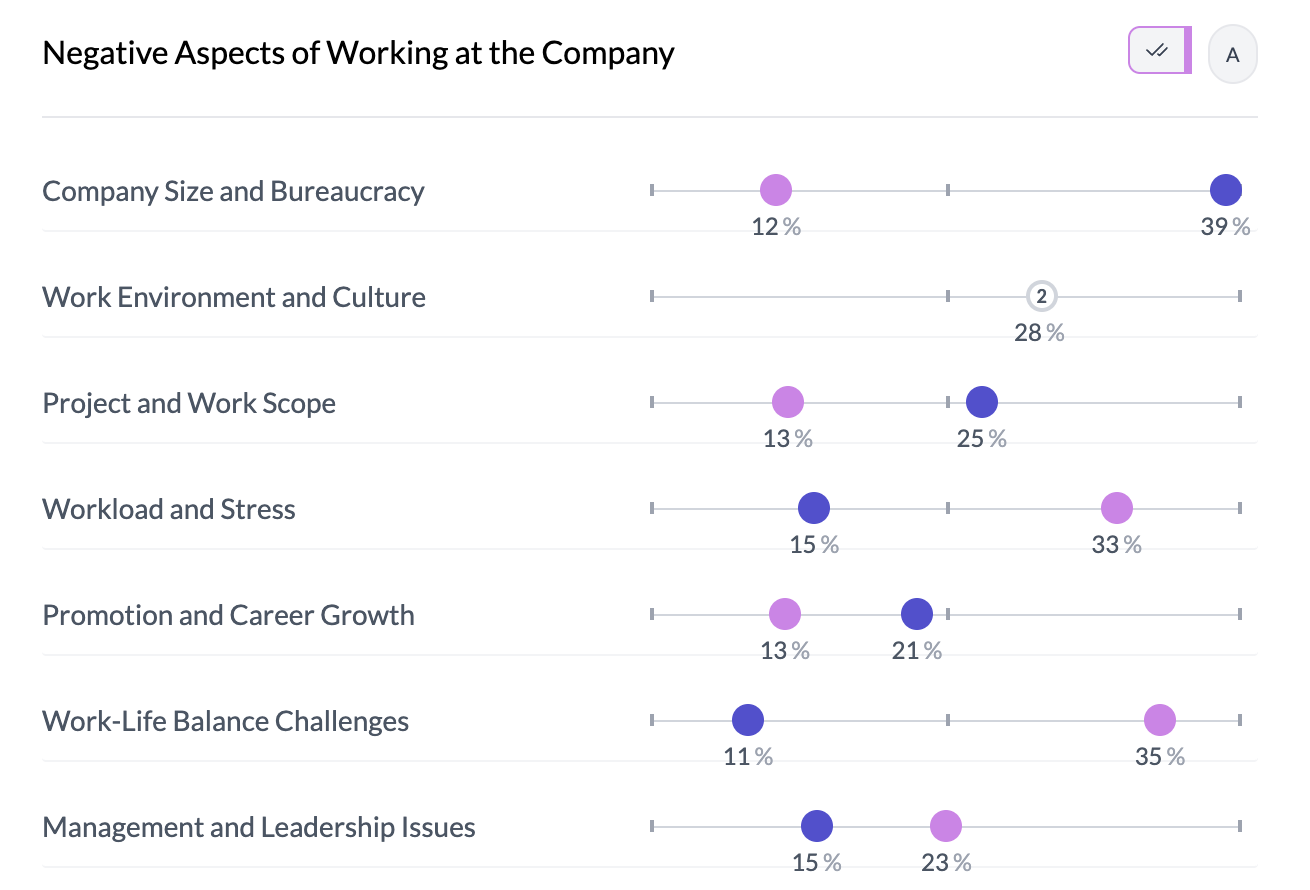
Dot charts (box plots and mean dot plots)
Single column bubble
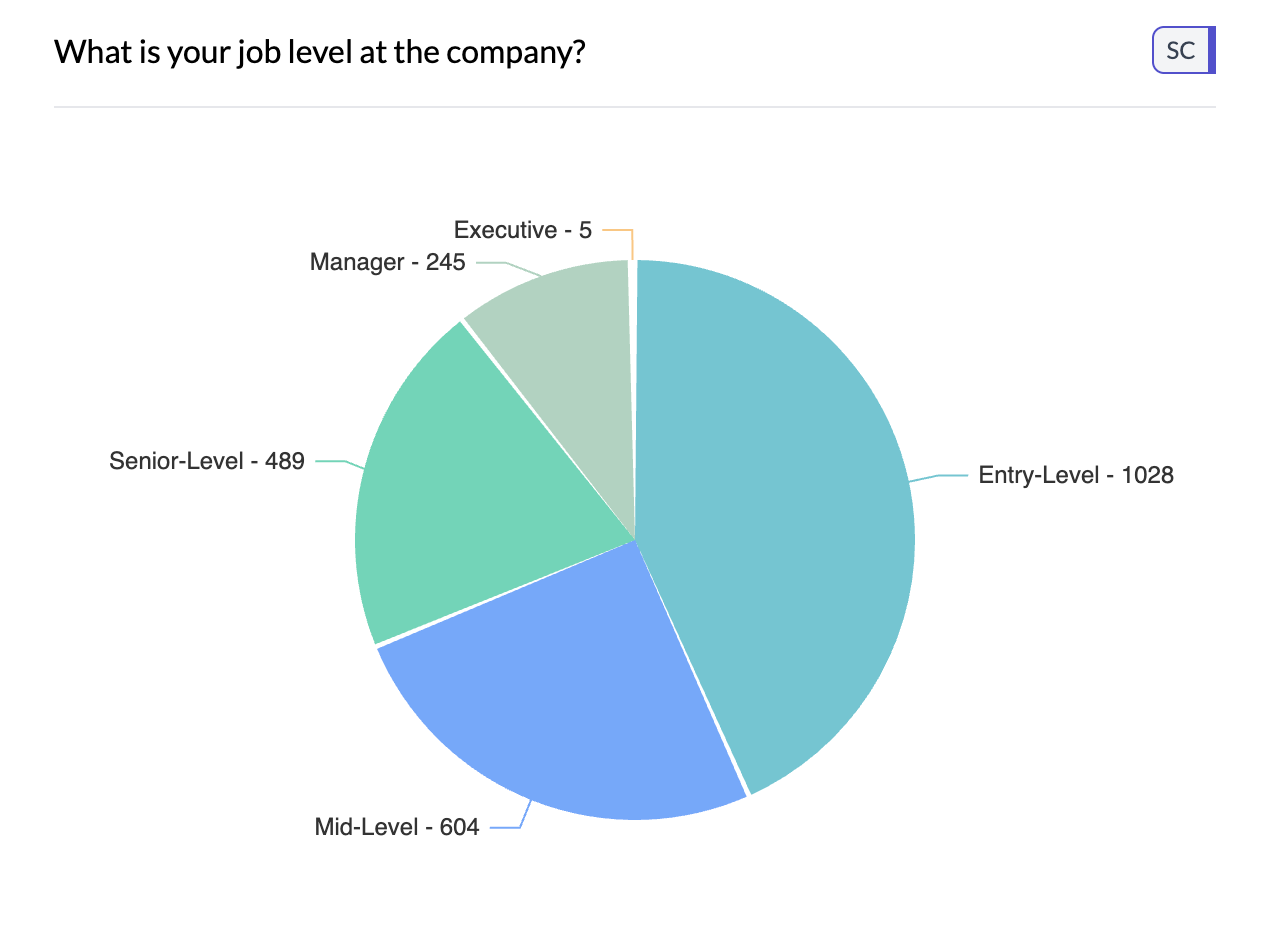
Pie chart
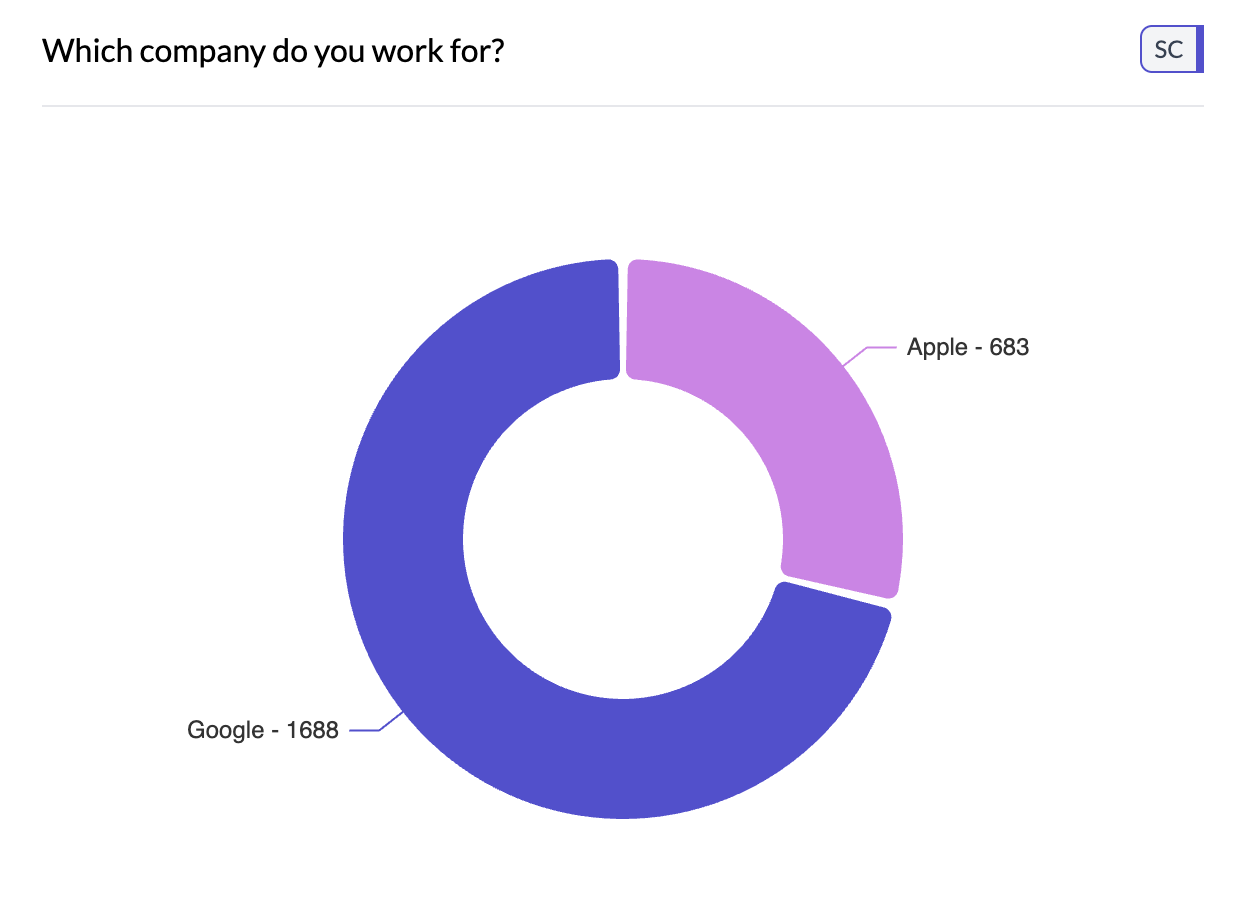
Donut chart
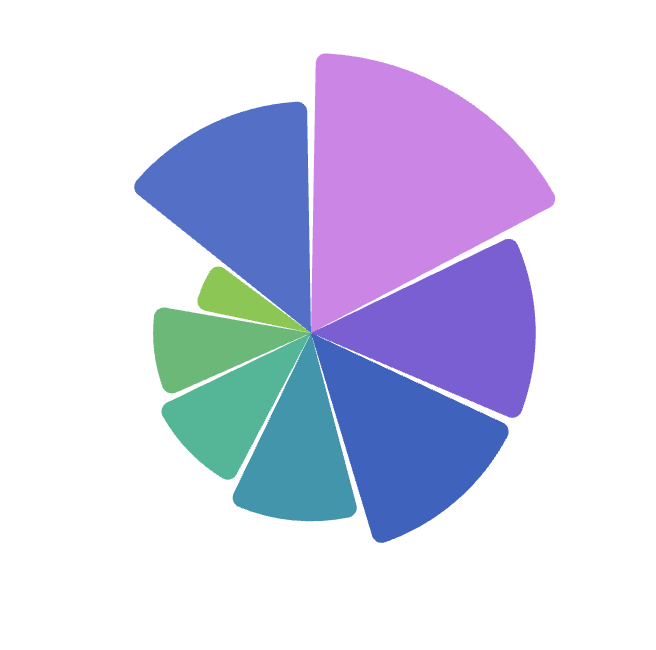
Rose chart
Word cloud

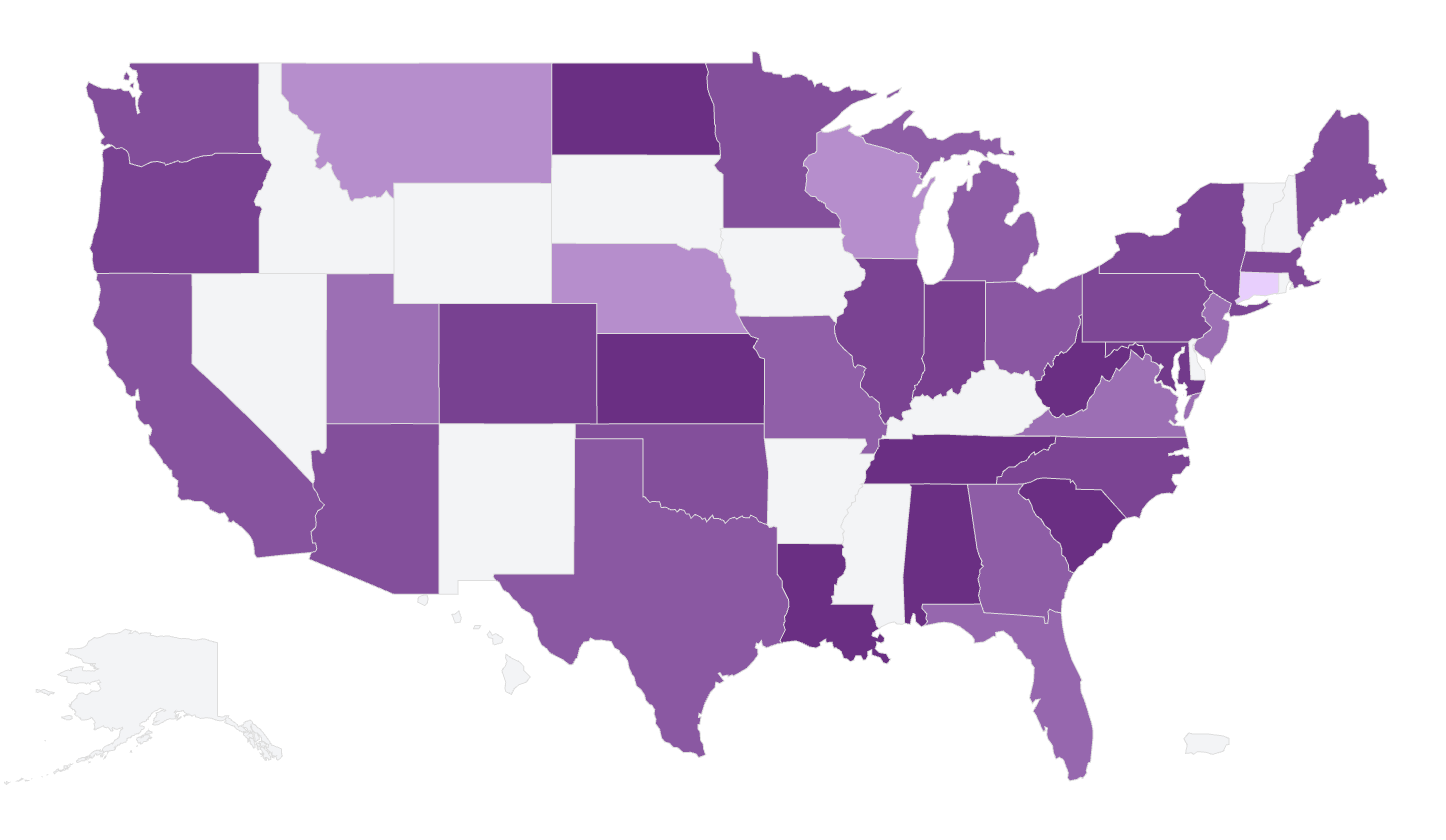
Geographic chart