Three Column Grouped Stacked Horizontal Bar Chart
A three column grouped stacked horizontal bar chart combines grouping and stacking: one dimension forms the row (e.g. region), a second dimension is shown as grouped bars (e.g. year or product), and a third is shown as stacked segments within each bar (e.g. response type). You get both group-to-group comparison and composition inside each bar.
When to use it
- Three categorical (or mixed) columns — Row, group, and segment dimensions.
- Sub-breakdowns within groups — e.g. Region (rows) × Year (groups) × Response (stacked segments).
- Grouping columns — Often used with grouped columns (e.g. several similar opinion questions grouped).
How to create it
- Add three columns to the pivot — In the sentence builder, select row, group, and segment columns.
- Choose bar view — Select Bar from the left menu when needed to get grouped bars.
- Set chart type — Use Stacked in the Stacked | Bar | Dot control so the third dimension appears as stacked segments.
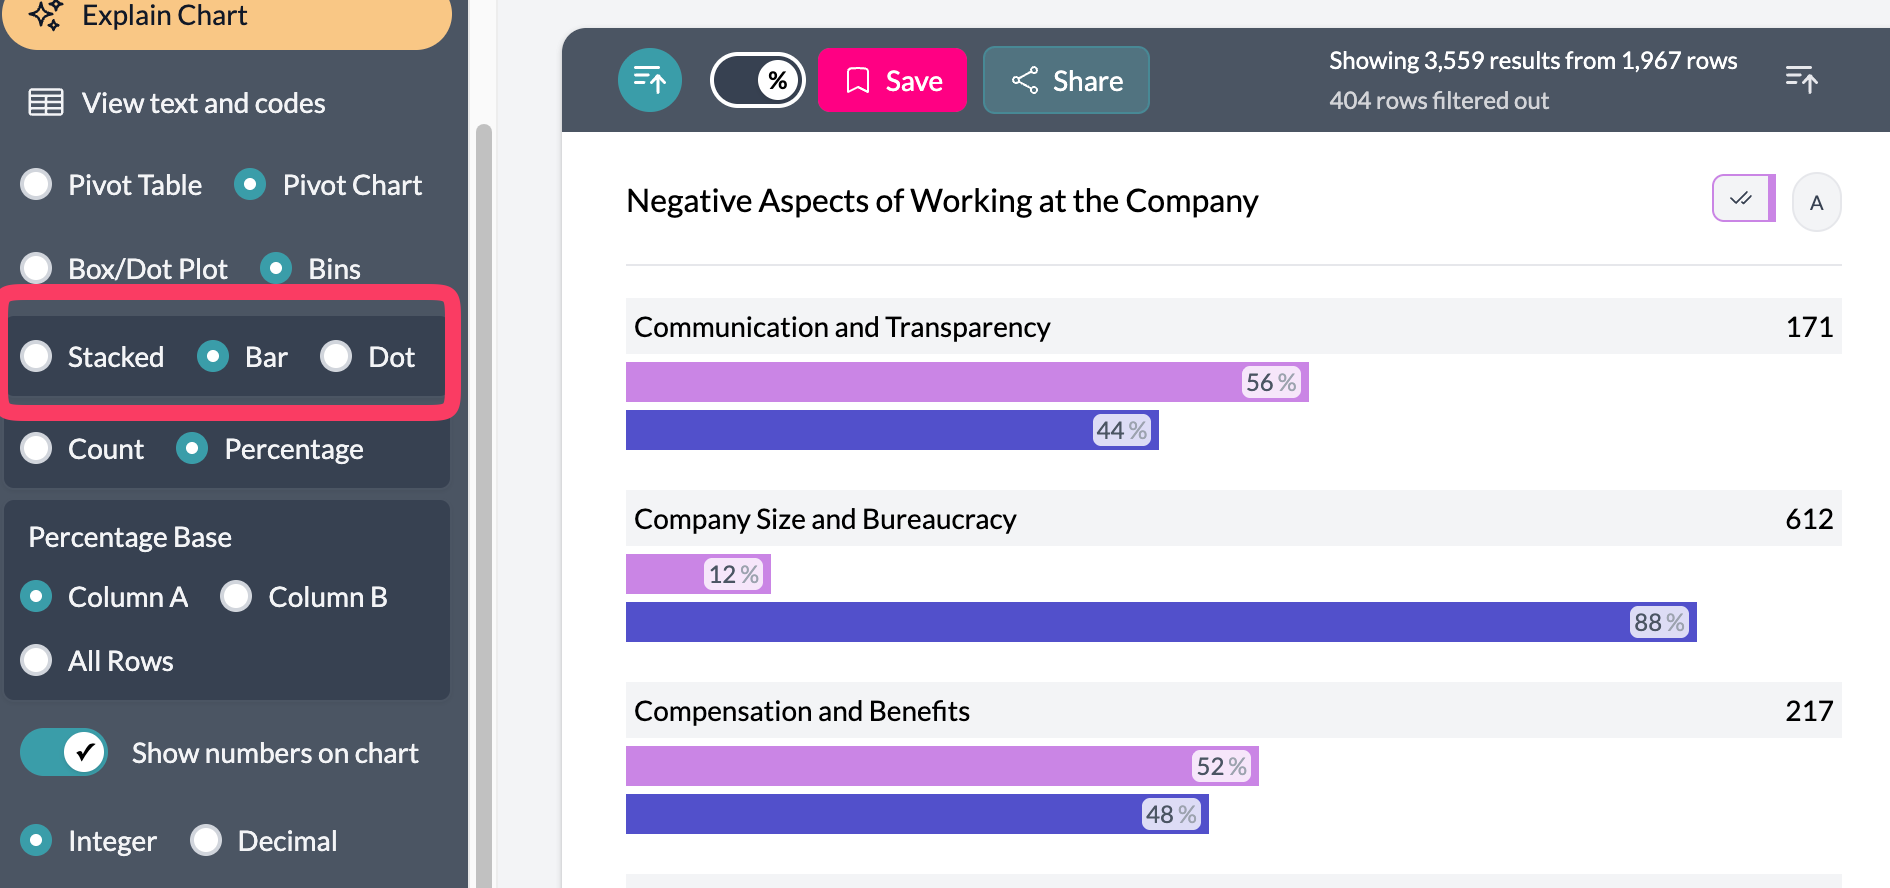
Grouping is especially useful when the second dimension is a group of similar columns (e.g. multiple Likert items) so you see one grouped bar per question and stacked segments for response options.

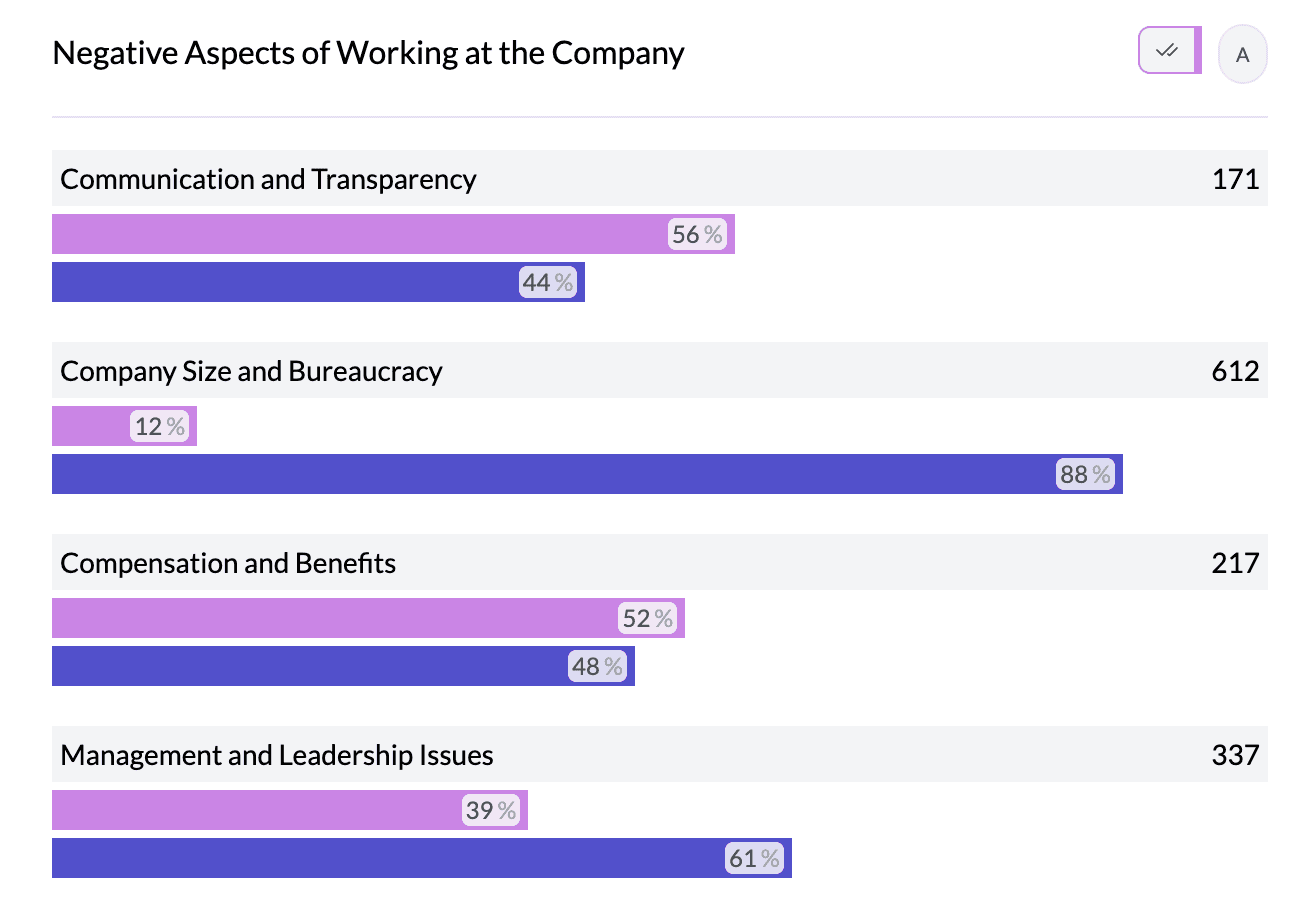
What you see
- Rows — One row per value of the first column.
- Grouped bars — Within each row, one bar (or cluster) per value of the second column.
- Stacked segments — Inside each bar, segments for the third column; length = count or percentage.
- Legend — Colors for the stacked (and optionally grouped) dimension.
See grouping columns, two column horizontal stacked, Likert chart.
Key points
- Three columns: rows, groups (grouped bars), and segments (stacked inside each bar).
- Use with column grouping for multiple similar questions or categories.
- Stacked | Bar | Dot and Percentage controls shape the view.