Two Column Vertical Stacked Bar Chart

A two column vertical stacked bar chart shows two columns as vertical bars: one dimension (e.g. time period or category) on the x-axis, and a second dimension as stacked segments within each bar. Bar height is the total count or aggregated value; segment heights show the breakdown.
When to use it
- Two columns, vertical layout — First column (e.g. month, region) as bars, second as stacked segments.
- Time + category — e.g. Month × Product type: each month is one bar, segments are products. Often used with time charts.
- Percentage — Use Percentage so each bar sums to 100% height for composition.
How to create it
- Add two columns — First: x-axis categories (e.g. date or category). Second: segment dimension (e.g. product, response).
- Use time or date column — When the first column is a date/datetime column, AddMaple may show a time chart with Columns (vertical bars) by default. If not, use the chart type control to choose vertical stacked bars.
- Stacked — Ensure the view is Stacked (not grouped bars or line) in the chart controls.
- Optional: Percentage — Select Percentage (or Proportional) so each bar shows composition. Use the chart control to switch to trend/line view or toggle percentage.
1Select trend chart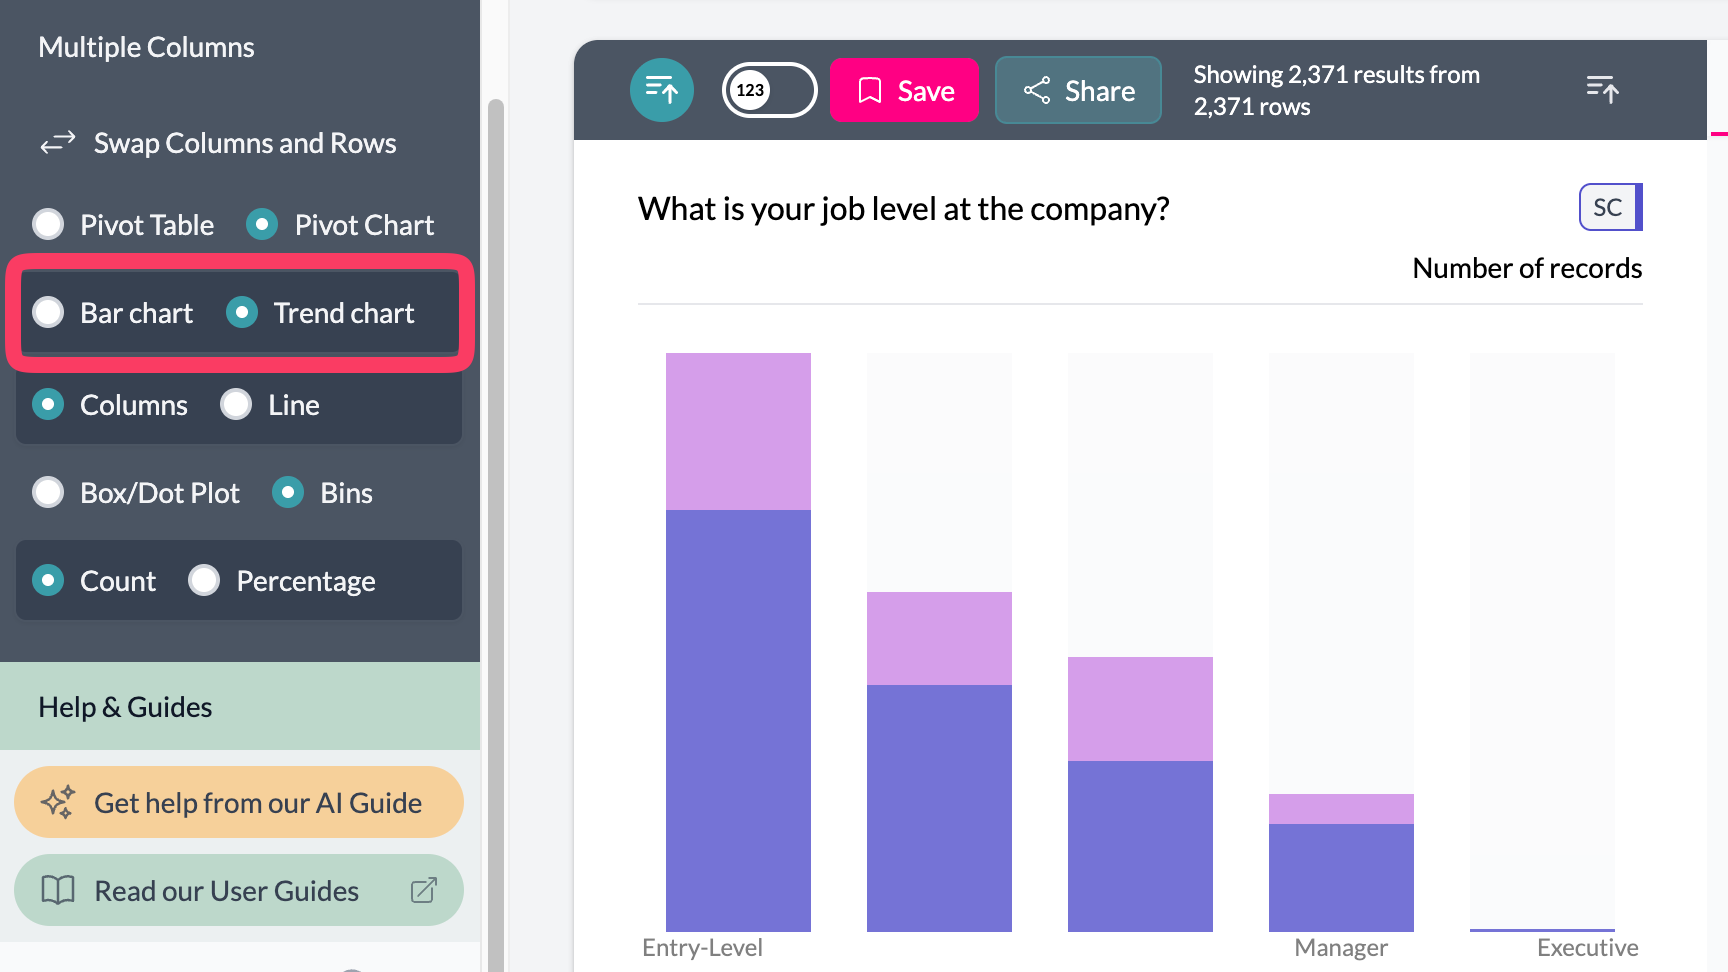 2Toggle percent
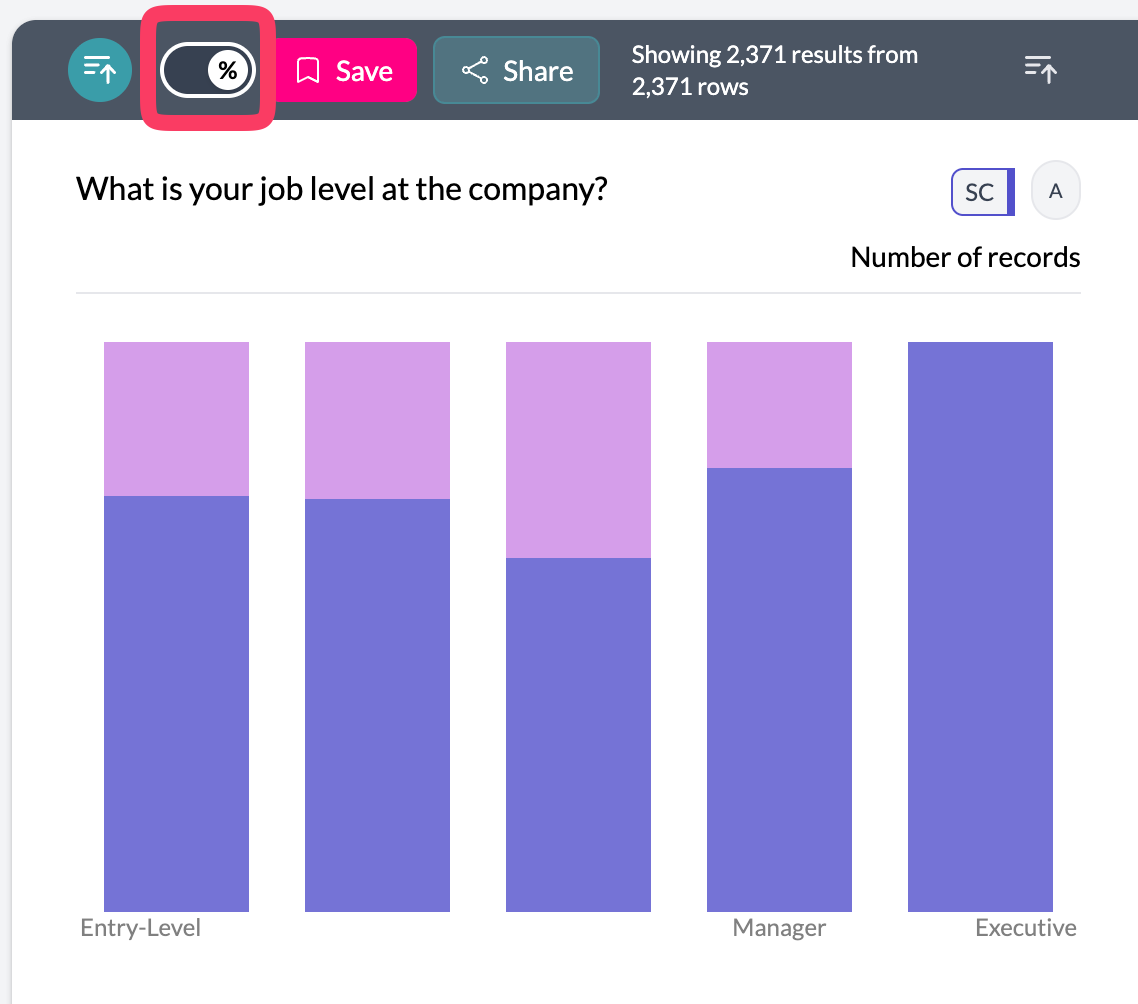 3Two column vertical stacked bar
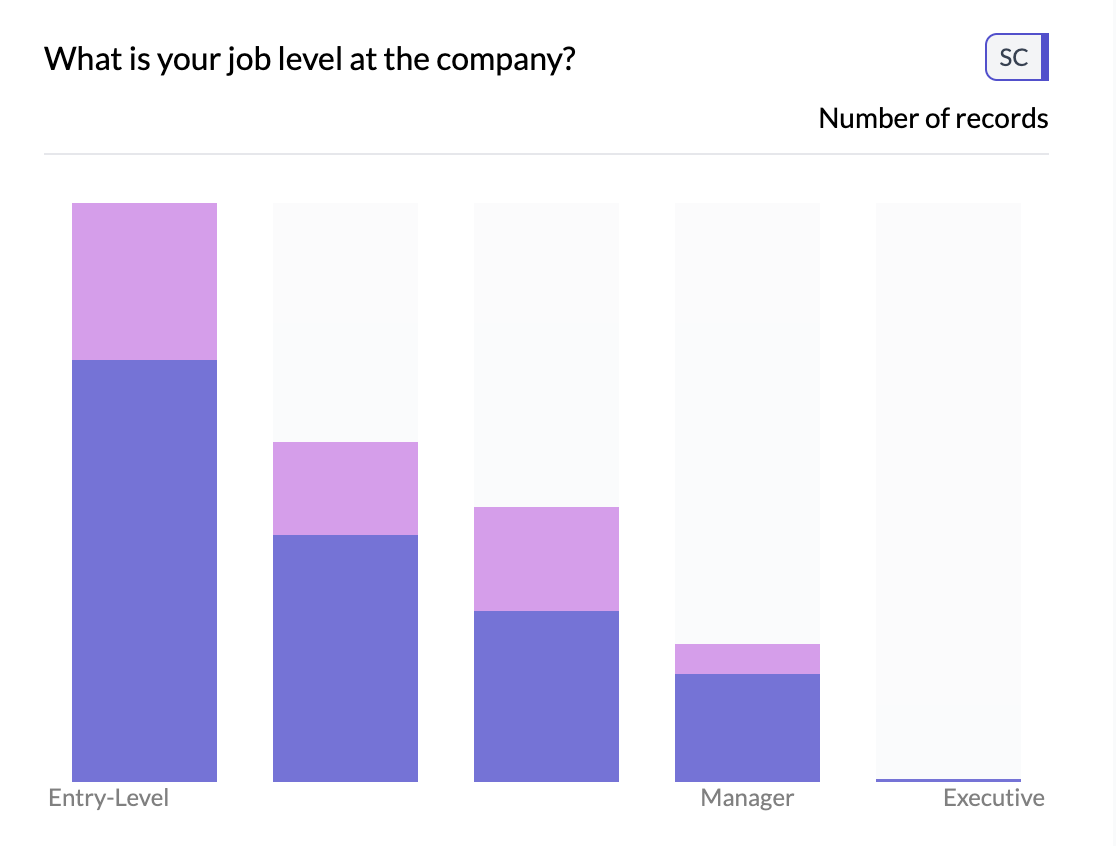
What you see
- One vertical bar per x-axis value — e.g. one bar per month or per category.
- Stacked segments — Each segment = one value of the second column; height = count or share.
- Legend — Second dimension categories and colors.
- Y-axis — Count or percentage scale.
See time charts and line/trend for the same data as columns/lines; horizontal stacked for horizontal layout.
Key points
- Two columns: x-axis = bars, second dimension = stacked segments; often used with date/time.
- Use Percentage for 100% stacked bars; switch to line view for trend emphasis.
- Same data can be shown as horizontal stacked bars or line chart.