
Exploring your data
AddMaple is built for exploration. When you open a project, every column is summarized on the Chart Dashboard. From there you can expand charts, pivot columns together, drill into rows, and—most importantly—filter your data to focus on the audience or segment you care about.
Filters in AddMaple are instant and global: once applied, they update every chart, table, pivot, statistical test, and related-column calculation across your project.
Ways to explore
| View | What it's for |
|---|---|
| Chart Dashboard | See every column at a glance; expand, filter, and pivot from any chart |
| Pivot charts | Compare two or more columns side by side |
| Table | Scan responses; click values to filter |
| Row by row | Read individual records in full, with cohort context |
Toggle between views from the top of the workspace. For a full survey-analysis walkthrough, see How to analyze a survey.
Add a filter
There are several ways to start filtering:
1. Filter button
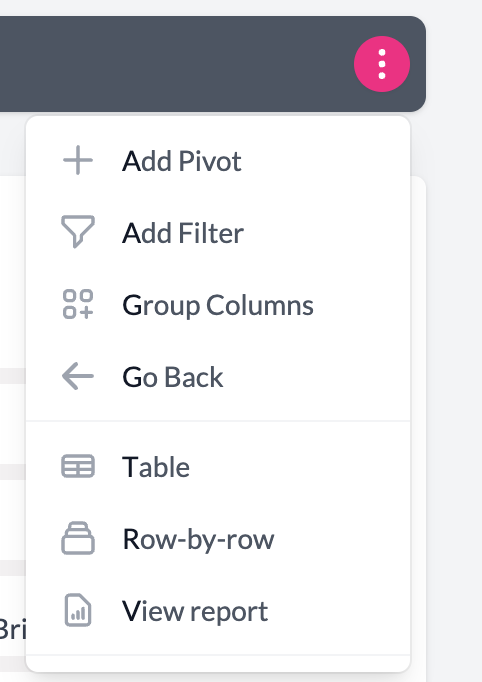
From the Chart Dashboard, table, or row view, click Filter at the top of the screen—or press / on your keyboard.
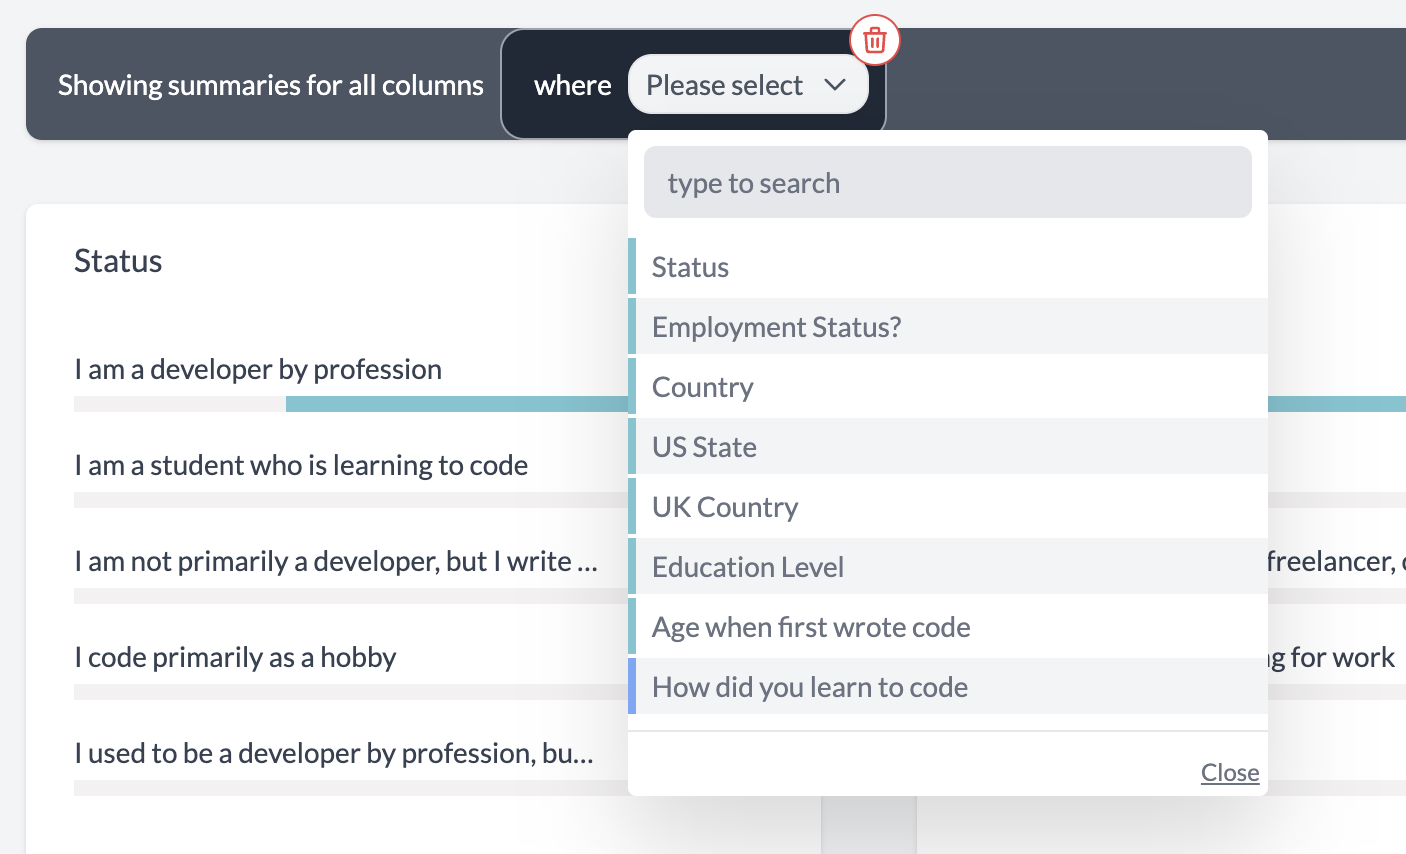
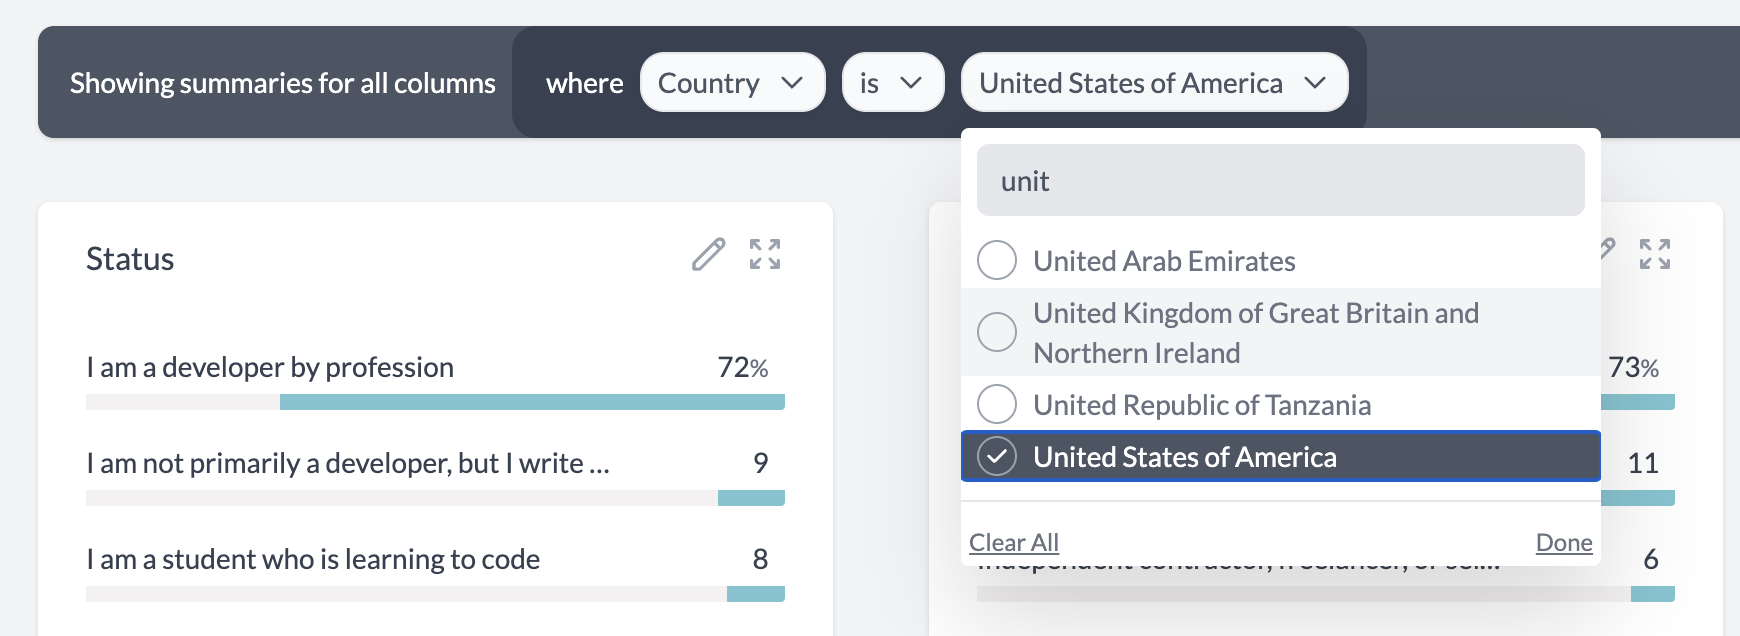
Choose a column, then choose how to filter. The options depend on the column type—for example, categorical columns support is and is not, while numeric columns support greater than, less than, and between.
2. From a chart
Expand a column, then hover over a bar (or segment) and click Filter by this value.

3. From a date chart
Click a bar on a date chart to filter to that date range.

4. From the table
In table view, click any categorical value in a row to add it as a filter.

You can also add filters from the sentence builder when pivoting. See Adding a filter.
Combine multiple filters with AND and OR
AddMaple supports advanced filtering: stack multiple filters and control how they combine. This is one of the most powerful ways to explore subgroups in your data.
How AND and OR work
- The first filter always uses AND logic.
- Each additional filter can stay on AND (narrow further) or switch to OR (broaden the match).
- AND filters narrow your audience: respondents must match all AND conditions.
- OR filters broaden a condition: respondents can match any OR option within that group.
AddMaple groups filters automatically: all AND conditions must be satisfied together, while OR conditions within the same column group create a broader match.
Examples
Narrow with AND — respondents who match every condition:
DepartmentisSalesANDAge Groupis25–34ANDOverall satisfactionis greater than or equal to4
Result: a tight segment of satisfied sales employees aged 25–34.
Broaden with OR — respondents who match any of several values:
CountryisUnited KingdomORCountryisIreland
Result: respondents from either country.
Mix AND and OR — common in real analysis:
Work locationisRemoteORWork locationisHybridANDTenureis greater than or equal to2years
Result: remote or hybrid workers with at least two years' tenure.
What updates when you filter
Filters remove rows before any calculation runs. When you apply or change filters:
- All charts and tables update instantly
- Pivot percentages and counts recalculate
- Related columns and statistical tests recalculate for the filtered audience
- Exports and dashboards reflect the filtered data
To see exactly which rows are included, check the status line above your pivot. See Filtering vs hiding.
Filter types by column type
AddMaple offers different filter operators depending on whether a column is numeric, categorical, multi-select, text, or a date. Examples include:
- Numeric — equal to, between, greater than, less than
- Single-select categorical — is, is not, has more than (minimum count threshold)
- Multi-select — includes any, includes all, doesn't include, count operators
- Text — contains, doesn't contain (with optional whole-word matching)
- Date — is between (click a bar on a date chart to pre-fill a range)
For the full reference table, see Use filter types.
Filters vs hiding
Filters remove respondent rows from the entire project. Hiding removes categories from a single chart without dropping rows from the dataset. Both can be active at once—the status line shows filtered rows, hidden categories, and weighted counts.
See Filtering vs hiding in pivot charts.
Build reusable audience segments
If you need a segment you'll reuse across charts—for example Detractors, Enterprise buyers, or Remote staff—create a custom variable instead of stacking filters each time. Custom variables appear as columns you can filter, pivot, and analyze like any other field.
For focused client views built from filters and segments, see Subgroup views.
Related guides
- Filter your data — quick FAQ summary
- Use filter types — full operator reference
- Filtering vs hiding — rows, results, and the status line
- Exploring related columns — find statistically meaningful relationships to explore next
- How to pivot your data
- Subgroup views — reusable audience cuts for client deliverables
Key points
- Filters apply instantly across your entire project
- Stack multiple filters and combine them with AND and OR
- Filter from the top menu, charts, tables, dates, or the sentence builder
- Related columns and stats recalculate when filters change
- Use custom variables for segments you reuse often