


Discover
Instant summaries across every variable
Upload research data and see every variable — distributions, categories, and response patterns — without building a dashboard first.
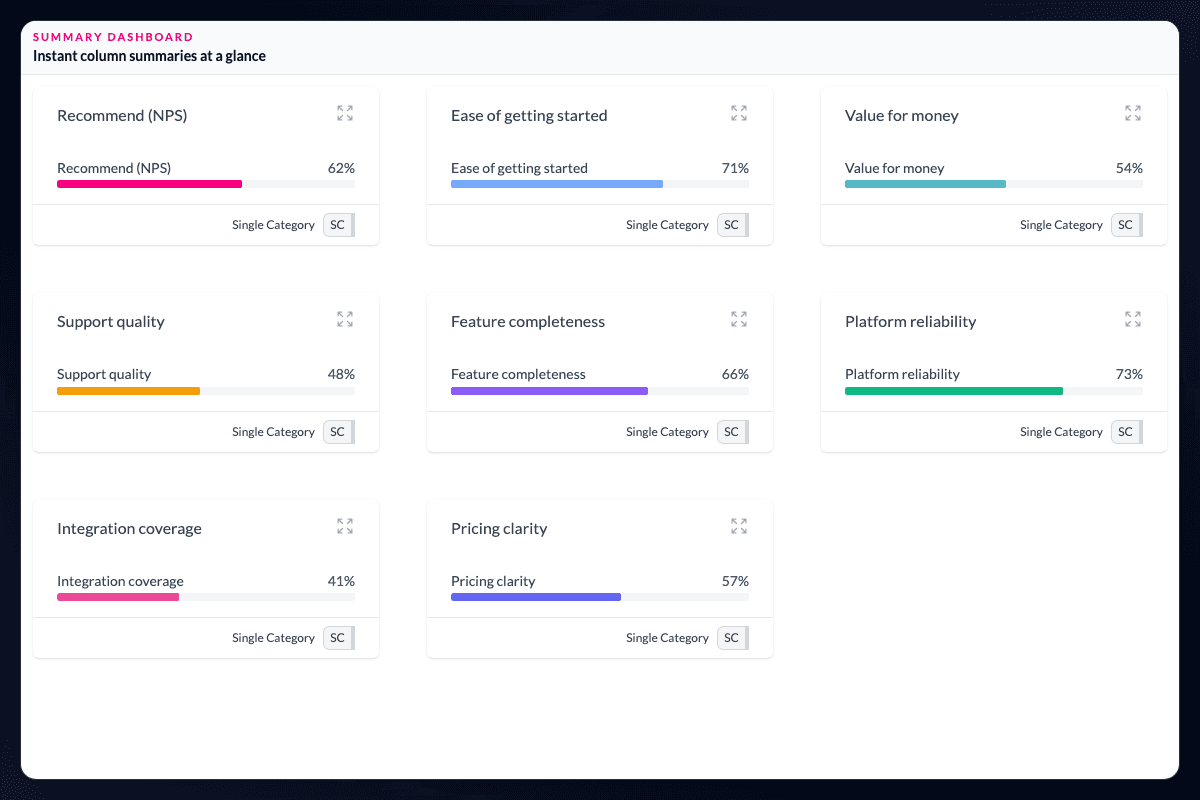
See what you have before someone builds a dashboard.
Upload research data and see every variable—distributions, categories, and response patterns—in an explore-ready chart. AddMaple infers text, single- and multi-category, opinion-scale, numeric, and date columns on import.
Start with the structures the study actually contains.
Multi-selects, Likert grids, weights, and multi-wave trackers surface as research-native structures rather than flat spreadsheet columns. Numeric variables are binned, categorical variables show frequency counts, and text columns open word clouds.
Turn orientation into a better next question.
Expand a variable to pivot it against others, inspect related columns, or move into deeper analysis. The first view helps researchers spot data-quality issues and decide which cuts deserve banners, drivers, or qualitative coding.
Give every analyst the same first view.
Instant summaries are useful because they make the initial orientation repeatable. Instead of beginning with whichever table someone happened to request, the team can see the shape of the dataset, notice unusual distributions, and choose the next analytical question from the evidence in front of them.
Questions teams ask
What does AddMaple show after I upload research data?
AddMaple shows distributions, categories, response patterns, and an explore-ready chart for each recognised variable.
Does AddMaple understand survey-specific variables?
Yes. Multi-selects, Likert grids, weights, and multi-wave trackers surface as research-native structures rather than flat spreadsheet columns.
Can I move from a summary into deeper analysis?
Yes. Expand a variable to pivot it against others, inspect related columns, or decide which cuts need banners, drivers, or qualitative coding.
How it works
Step-by-step guides in the AddMaple help center.
- Instant automatic analysis
See how AddMaple detects column types, bins numeric data, and summarizes every variable as the import completes — without building a dashboard first.
Part of AddMaple's feature areas
This capability sits within broader product areas on the features hub.
- Data preparation & live research data
Continue exploring
Follow the next step in the workflow or explore a related capability.
- Data Table StudioBuild interactive banner tables and ranked crosstabs in-product — significance shading, bases and indices, subgroup ranking, crosstab-level AI, and formatted Excel tab books.
- Ask Maple — AI analysis agentAsk Maple operates AddMaple's analysis capabilities in project context — tables, relationships, key drivers, regression, segmentation, qual coding, and explainable statistical evidence — not a generic chat about data.
See this capability on a real research workflow.
Bring one study or delivery workflow and we’ll show where AddMaple fits.