


Discover
Turn qualitative themes into quantitative evidence
Code open ends and transcripts into themes, inspect verbatims, convert themes to variables, and cross-tab and test them against quant — in one loop.
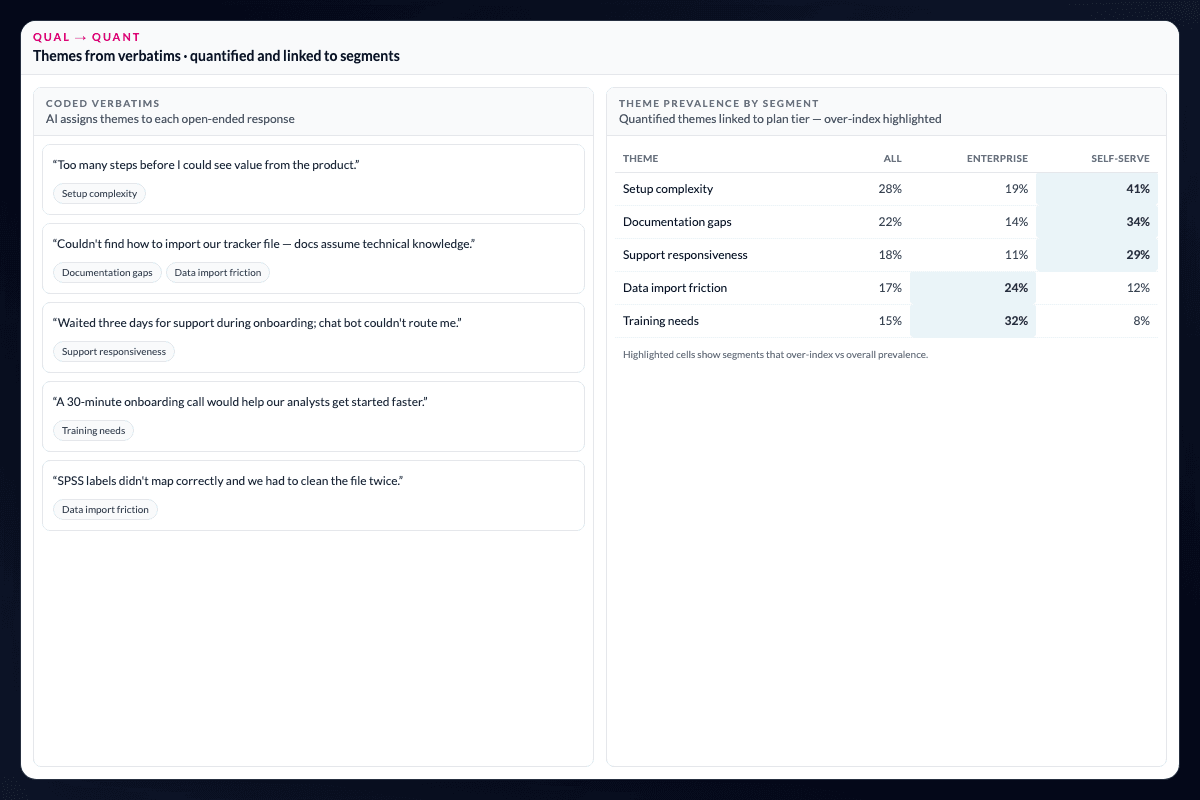
Turn reviewed themes into variables you can test.
After coding and reviewing the source records, save themes as project variables alongside structured survey data.
Raw responses → AI-assisted coding → Themes + verbatims
→ Convert to variables → Cross-tab against quant → Test statistically
Let qualitative evidence enter the same analysis.
Once themes become project columns, they behave like survey variables: filters, banners, significance tests, key-driver analysis, and segmentation can all work on coded qual. AI can generate or apply a codebook, while researchers review records, refine descriptions and examples, merge or split themes, and re-apply codes across the dataset.
Keep the words attached to the numbers.
Open text no longer has to sit in a separate appendix or be exported for a manual merge. Every code remains traceable to source phrases, so verbatims can explain the quantitative pattern in the same workflow. From there, use linked quant and qual analysis to investigate the questions that follow.
Make the transition from theme to evidence explicit.
The important step is not simply producing a list of topics. It is turning a reviewed interpretation into a variable with a defined meaning and a visible source path. That lets a researcher state exactly which respondents are included in a theme, compare them with other groups, and decide whether the pattern is strong enough to carry into the study’s conclusions.
Questions teams ask
How do qualitative themes become quantitative variables?
After coding and reviewing source records, save themes as project columns. They can then be filtered, cross-tabulated, and tested alongside structured survey variables.
Can I review the records behind a coded theme?
Yes. Themes remain traceable to the source phrases and verbatims used to support them.
What can I do with a qualitative project column?
Use it in filters, banners, significance tests, key-driver analysis, and segmentation like other project variables, subject to the data and method.
Read the evidence in context
Results depend on the study design, data quality, bases, weighting, and method settings. AddMaple calculates the statistical outputs; researchers review practical importance and interpretation. An association is not evidence of causation.
How it works
Step-by-step guides in the AddMaple help center.
- Thematic Coding
Generate an initial code frame with AI, review assignments, refine codes iteratively, and convert themes into variables you can cross-tab against quant.
- Connect open-text with survey results
Code open ends and filter themes by the same banners, scores, and segments you use in quant analysis.
Part of AddMaple's feature areas
This capability sits within broader product areas on the features hub.
- Text & qualitative analysis
Continue exploring
Follow the next step in the workflow or explore a related capability.
See this capability on a real research workflow.
Bring one study or delivery workflow and we’ll show where AddMaple fits.