


Discover
Quant & qual linked analysis
Connect coded open ends and structured survey data in one inspectable workspace — not separate stories.
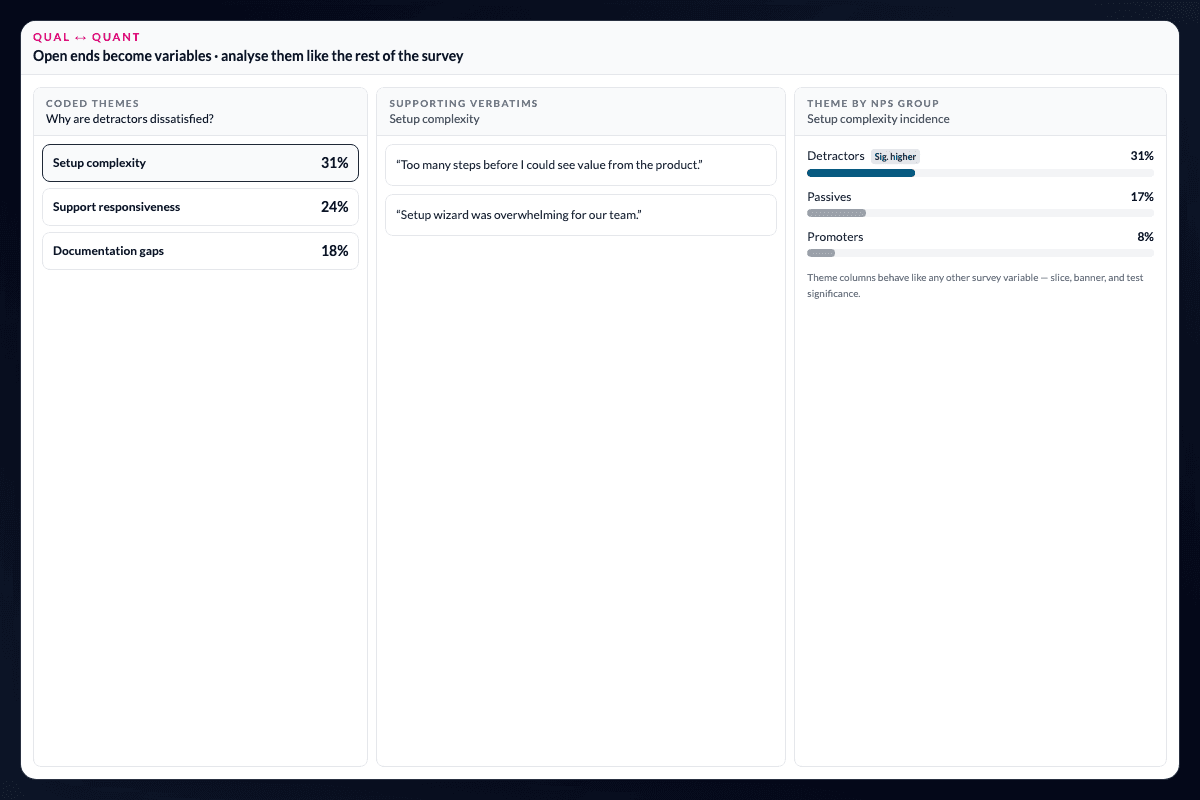
Let open ends explain the numbers in the same workspace.
Connect coded open ends and structured survey data without creating parallel stories. Multi-language open ends, interview transcripts, and survey verbatims can sit alongside the study’s structured data as one evidence base.
A typical cut: respondents mentioning price concerns have a different NPS, over-index in a segment, and are significantly more likely to report onboarding difficulty — then you click through to see exactly what they said.
Ask questions across the whole evidence base.
Filter a quantitative cut by a qualitative theme—for example, show NPS among respondents who mentioned price concerns. Run related columns on a theme to see which structured variables associate with it, or include themes as drivers or clustering inputs alongside demographics and behaviours.
Give qualitative themes the same analytical treatment.
Pivot qual against quant with the same significance shading and chart types as standard survey variables. With every theme traceable to its verbatims and every quantitative cut testable against coded evidence, stakeholders can move from “what did people say?” to evidence they can inspect.
Keep one evidence base for the questions that follow.
The connection matters when the first answer creates a second question: whether a theme is concentrated in one segment, whether it relates to an outcome, or whether a reported score reflects a specific experience people described. AddMaple lets the analyst pursue those questions without exporting the coded data, manually joining respondent records, or losing the link to the original words.
Questions teams ask
How does AddMaple connect qualitative and quantitative data?
Coded themes become project variables that can be filtered, pivoted, tested, used in driver analysis, and included in segmentation alongside structured survey columns.
Can I see what respondents said behind a quantitative pattern?
Yes. Themes remain traceable to their underlying verbatims, so a quantitative cut can be connected back to source language.
Can I use a qualitative theme as a driver or segment input?
Yes. Coded themes can be used alongside demographics and behaviours in key-driver and clustering workflows, subject to the method and data.
Read the evidence in context
Results depend on the study design, data quality, bases, weighting, and method settings. AddMaple calculates the statistical outputs; researchers review practical importance and interpretation. An association is not evidence of causation.
How it works
Step-by-step guides in the AddMaple help center.
- Connect open-text with survey results
Code open ends in AddMaple and filter themes by the same banners, scores, and segments you use in quant — keeping qual and quant in one workspace.
Part of AddMaple's feature areas
This capability sits within broader product areas on the features hub.
- Text & qualitative analysis
- Key drivers, regression & relationships
Continue exploring
Follow the next step in the workflow or explore a related capability.
- Open ends, transcripts & qualitative codingAI-assisted coding into themes and optional topic-sentiment, with evidence paths back to underlying verbatims.
- Key driver analysisWhich factors are most strongly associated with an outcome? Rank drivers with target-appropriate models, then inspect the evidence before it becomes a recommendation.
See this capability on a real research workflow.
Bring one study or delivery workflow and we’ll show where AddMaple fits.