


Discover
Segment profiling & comparison
Profile who each segment is and what differentiates them — ranked features, lift vs overall, and comparison views ready for banners, charts, and client storytelling.
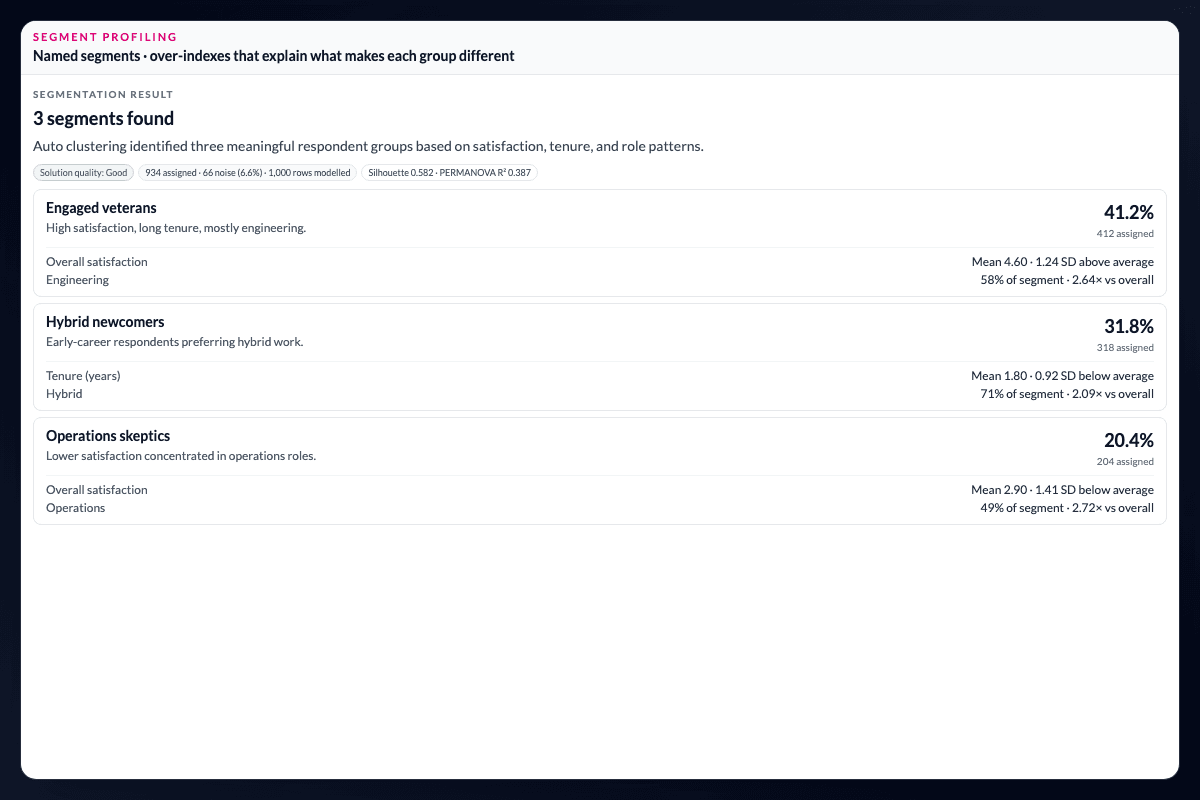
What makes each segment different?
After clustering or researcher-defined segmentation, AddMaple surfaces the variables that distinguish each group. A “Cluster 3” label becomes evidence about who people are, what they believe, and how they differ from the overall sample.
Profile the groups with evidence.
- Numeric features — cluster mean and z-score against the dataset average.
- Categorical features — share within the cluster and lift (×) against overall.
Compare the segments side by side.
Comparison views rank features across segments, making it easier to turn a statistical grouping into a story stakeholders can understand. Save the segments for tables, charts, filters, key-driver analysis, and exports—without rebuilding banner categories from an export.
Give the segment a meaning stakeholders can use.
Profiling is where a statistical solution becomes a research finding. The analyst can name the characteristics that distinguish a group, compare those characteristics with the overall sample, and decide whether the pattern is useful for the business question. The saved segment then remains available for the tables and presentations that carry the finding forward.
Questions teams ask
What does segment profiling show?
Segment profiling shows the variables that distinguish each group, including numeric means and z-scores and categorical shares and lift against the overall sample.
Can I compare saved segments side by side?
Yes. Comparison views rank features across segments so researchers can examine how the groups differ.
Where can I use a profiled segment?
Saved segments can be reused in tables, charts, filters, key-driver analysis, and exports without rebuilding banner categories.
Read the evidence in context
Results depend on the study design, data quality, bases, weighting, and method settings. AddMaple calculates the statistical outputs; researchers review practical importance and interpretation. An association is not evidence of causation.
How it works
Step-by-step guides in the AddMaple help center.
- Profile and compare segments
Read z-scores and lift on cluster profiles, name personas, and compare saved segments in tables, charts, and significance testing.
- Run a segmentation
Create clusters in the Create Clusters wizard, then review segment details before saving a segment column.
Part of AddMaple's feature areas
This capability sits within broader product areas on the features hub.
- Segmentation & advanced analysis
Continue exploring
Follow the next step in the workflow or explore a related capability.
- Segmentation & clusteringWhich groups actually exist in this audience? Compare clustering approaches suited to numeric, categorical, or mixed survey data, then profile the groups you can use.
- Ranked subgroup differencesIn Data Table Studio, surface which questions differ most across a banner first — ranked by statistical strength, including quant variables and AI-coded themes.
See this capability on a real research workflow.
Bring one study or delivery workflow and we’ll show where AddMaple fits.