


Discover
Regression, PCA & multivariate modelling
What is the estimated relationship — and what structure sits behind the batteries? Model outcomes with linear and logistic regression, Elastic Net multivariate drivers, and PCA in the same project — with fitted charts and inspectable coefficients.
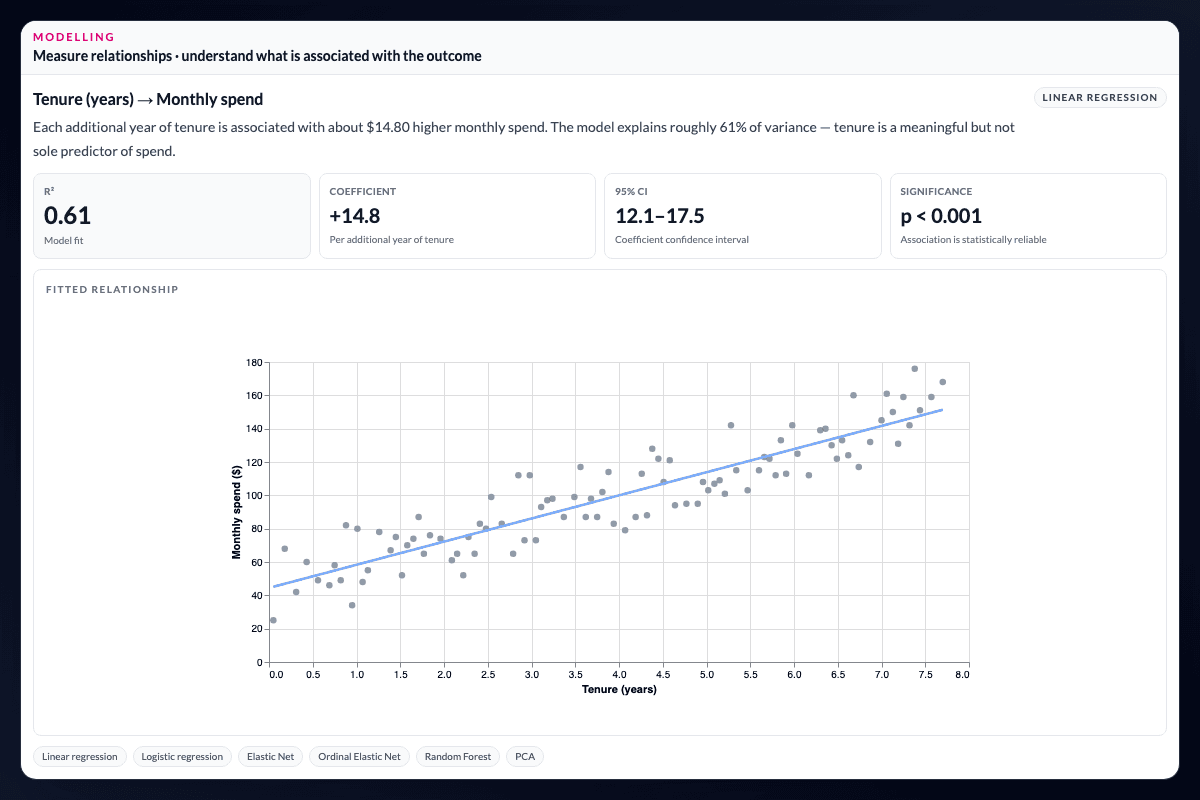
What is the estimated relationship — and what structure sits behind the batteries?
When the question moves beyond crosstabs and one-at-a-time rankings, AddMaple keeps explicit multivariate modelling inside the live project — with fitted charts, inspectable coefficients, and save-to-Insights workflows. You do not need a separate stats stack to move from tables to models.
Linear and logistic regression
Build a focused regression model the researcher chooses and reviews directly.
- Linear regression — numeric predictor and numeric outcome; scatter plot with regression line, R², coefficient, confidence interval, and plain-language interpretation.
- Logistic regression — numeric predictor and binary outcome (two-category tag, boolean, or assigned-scale column); fitted curve, log-odds, pseudo R², and odds-ratio interpretation.
Outlier toggles, jitter, and chart views make the fit reviewable before it becomes a recommendation. Save results to Insights or dashboards so stakeholders can revisit the estimate without rerunning it.
Multivariate drivers with Elastic Net and Random Forest
When many candidate factors could explain an outcome, use key driver analysis in the same project:
- Elastic Net — numeric outcomes with regularised coefficients across many predictors; direction and magnitude stay interpretable.
- Logistic Elastic Net — binary outcomes with multivariate regularisation.
- Ordinal Elastic Net — ordered scales such as NPS or agreement grids where category order matters.
- Multinomial Elastic Net — unordered multiclass outcomes with class-specific driver evidence.
- Random Forest — complex mixed-type patterns with out-of-bag fit when relationships are non-linear.
Automatic routing picks a target-appropriate model; analysts can override when the study demands a specific approach. Related-column discovery surfaces plausible drivers before you run the multivariate model.
PCA and dimension reduction
Run principal component analysis on numeric and opinion-scale batteries to explore latent structure and reduce dimensionality beyond one-at-a-time crosstabs.
- Select correlated attitude, rating, or sensory columns and review loadings and variance explained.
- Optional Varimax rotation for simpler, more interpretable dimensions.
- Use component maps and loadings to decide how to tell the story — or feed components into segmentation when the study calls for it.
PCA is exploratory: it summarises co-movement in the data, not causal drivers. For outcome ranking across many candidates, start with key driver analysis.
Choose the method that answers the question.
- Which of many factors matter most for an outcome? Start with key-driver analysis — Elastic Net, ordinal or multinomial Elastic Net, or Random Forest depending on the target.
- What is the estimated relationship for a focused predictor and outcome? Use linear or logistic regression with a reviewable scatter or curve.
- What underlying dimensions sit behind this battery? Use PCA.
- Which items or concepts win preference tasks? Use MaxDiff, TURF & Conjoint.
“What happens to spend as tenure rises?” is a focused regression question. “Which of twelve experience drivers best explain NPS?” is a multivariate key-driver question. “What are the main dimensions in this attitude grid?” is a PCA question. Keeping those workflows distinct preserves statistical clarity.
Keep the estimate attached to its assumptions.
Regression and driver models make relationships easier to inspect, but they do not make an observational result causal by themselves. Review predictor and outcome definitions, model fit, outliers, bases, and study design before carrying a coefficient into a recommendation. Saving the model to Insights or a dashboard keeps that context available when the result is revisited.
Questions teams ask
What is the estimated relationship between a predictor and an outcome?
Use linear regression for numeric predictors and outcomes, or logistic regression for a numeric predictor and binary outcome. Each includes scatter or fitted-curve charts, coefficients, model fit, confidence intervals where applicable, and plain-language interpretation.
Which factors matter when many predictors could explain the outcome?
Use key driver analysis in the same project. AddMaple runs multivariate models across mixed-type predictors — Elastic Net, logistic Elastic Net, ordinal Elastic Net, multinomial Elastic Net, and Random Forest — with automatic routing based on the outcome.
What structure sits behind a correlated attitude or rating battery?
Run PCA on numeric and opinion-scale columns to explore loadings, variance explained, and optional Varimax rotation. Components can inform segmentation or storytelling while staying beside the project's tables and charts.
When should I use regression instead of key-driver analysis?
Use regression for a focused estimate between named predictor and outcome columns with a reviewable fit chart. Use key-driver analysis when you want to rank many mixed-type factors by importance with regularised multivariate models such as Elastic Net or Random Forest.
Read the evidence in context
Results depend on the study design, data quality, bases, weighting, and method settings. AddMaple calculates the statistical outputs; researchers review practical importance and interpretation. An association is not evidence of causation.
How it works
Step-by-step guides in the AddMaple help center.
- Regression
Build linear or logistic regression models with coefficients, odds ratios, scatter plots, and plain-language interpretation of the relationship between predictors and outcomes.
- Key Driver Analysis
Rank drivers with Elastic Net, ordinal and multinomial Elastic Net, and Random Forest when many predictors could explain the outcome.
- PCA & dimension reduction
Run principal components on numeric and scale batteries — interpret loadings, variance explained, optional Varimax rotation, and component maps.
- Choose the right statistical analysis
Map your research question to regression, PCA, drivers, segmentation, and choice models.
Part of AddMaple's feature areas
This capability sits within broader product areas on the features hub.
- Key drivers, regression & relationships
Continue exploring
Follow the next step in the workflow or explore a related capability.
- Key driver analysisWhich factors are most strongly associated with an outcome? Rank drivers with target-appropriate models, then inspect the evidence before it becomes a recommendation.
- PCA & dimension reductionWhat underlying dimensions sit behind this battery? Explore latent structure with PCA, loadings, variance explained, and optional Varimax rotation.
- Advanced research methodsSpecialist research methods for preference and portfolio decisions — MaxDiff for item importance, TURF for reach and optimal combinations, and Conjoint for attribute trade-offs and scenario simulation — connected to the same tables, charts, and narrative as the rest of the study.
- Statistical testing & significanceWhich differences are evidence, not noise? Named tests, effect sizes, and multiple-comparison correction — selected by variable type, with inspectable results.
See this capability on a real research workflow.
Bring one study or delivery workflow and we’ll show where AddMaple fits.