

1
Connect your data.
An SPSS, CSV, Excel, Word or PDF file, or your data lake.

Proactive insight discovery · IIEX West, San Francisco
Surface the insights that could have the biggest growth impact, and bring them to the business while there's still time to act.
Sophisticated data science. Made remarkably simple.
Bring a past study.See what might have been missed.
IIEX WESTSan Francisco · 2026
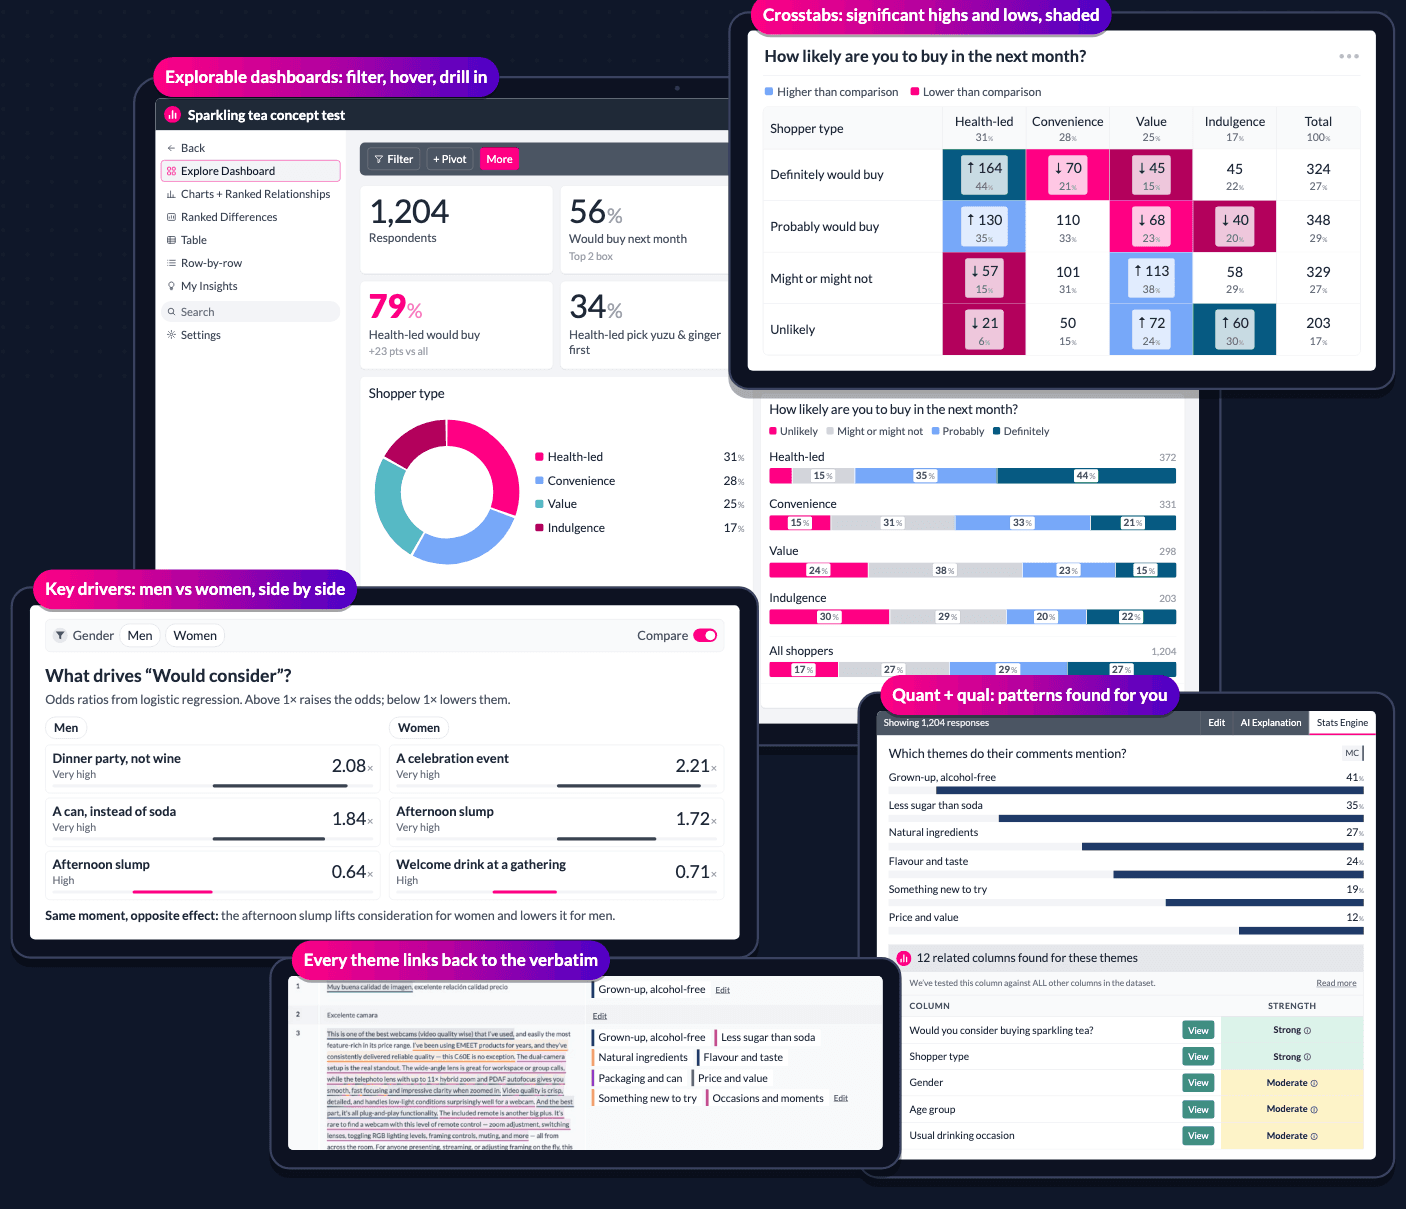
Your everyday workflow
Prefer to work through the study yourself? Everything is ready the moment your data lands.
1
An SPSS, CSV, Excel, Word or PDF file, or your data lake.
2
In seconds, every question is summarised into charts and tables, and every pair of questions is tested for correlation.
3
The AI works from results already calculated and drives the interface for you, building the chart and applying filters, so your answer comes in words and as a visual you can use.
An evidence engine for modern insight teams
One statistical engine investigates the whole study. The method adapts to each question and data type, so you get to the findings without setting up tests one by one.
Drivers are associations to investigate, not proof of cause.
Differences
Every audience, market and wave gap tested. Spot differences worth paying attention to.
Drivers
See which factors are most strongly linked to the result you want to improve, across several models.
Segments
Our AI agent tries different ways of grouping people and brings you groups that are distinct and easy to describe.
Patterns
Links across ratings, categories and multi-select questions you didn't plan to test.
Themes
Open ends coded into themes and ranked alongside the numbers.
Opinions, preferences, attitudes, segments and themes, pulled into one ranked report. Ranked Impact Analysis. Multi-Type Adaptive Discovery: established statistical and machine-learning methods, selected and combined to fit the question and the data.
Confidence in an AI world
Insight teams don't have to work backwards from an AI answer to spot-check the evidence. AI can help you move faster. But checking generated code, tracing calculations and keeping track of every analytical decision can slow you down again.
AddMaple gives your team a consistent statistical engine, visible filters and inspectable results. Explore further, compare audiences and follow the evidence without rebuilding and rechecking the analysis at every step.
Move at AI speed. Keep your confidence in the numbers.
The engine does the calculating. AI explains the results; it doesn't compute them.
Bases, tests and model diagnostics are there to inspect, so anyone can see what a finding rests on.
Numerical results are reproducible for the same data, methods and settings. The AI's wording may vary.
One statistical engine. All your AI tools.
Explore in AddMaple, or from Claude, ChatGPT or Cursor. One engine runs every calculation, so results are consistent, reproducible and shown in full. No AI-written code to audit.
Quant and qual, together
Open ends, interview transcripts and videos are coded into themes and ranked with the survey data, with every quote and clip linked back to the evidence.
A team capability
Make discovery a team capability, not a specialist bottleneck. Brand, product and category colleagues can explore a study themselves. The AI never does the maths: our statistical engine runs every calculation, table and test, so each question gets the same answer, whatever the experience or phrasing.
Your tools. Your data. The same rigorous evidence.
You shouldn't have to choose between the AI tools you love and the statistical rigor your work demands. Connect SPSS, CSV, Excel, Word or PDF files, or your data lake, and use your own AI. AddMaple stays the calculation engine and the evidence source.
Find what others miss. Show why it matters. Inspire action.
What's new
A new engine, new ways to build tables, segmentations and stories, and AI that operates the same analysis you do.
The foundation
NewRebuilt around how research is actually structured, so your study stays a study.
Prepare
NewBuild the measures a study needs in the same project, with the definition kept beside the data.
Tables
NewInteractive banner tables and crosstabs, built inside the product.
Quant + qual
NewAI-coded open ends sit in the same ranked table view as your survey questions.
Dimensions
NewFind the dimensions behind a battery without leaving the study.
Drivers
NewTarget-appropriate models on mixed survey data, with the evidence in view.
Segmentation
NewRun several approaches on numeric, categorical or mixed survey data and keep the one you trust.
Deliverables
NewFormatted workbooks with a table of contents, brand styling and the full statistical context.
Brand tracking
NewGroup a battery as a Category entry points family and analyse it as one thing.
AI
NewAI that operates AddMaple, from inside the product or from the tools you already use.
Delivery
NewPage-based stories built from live charts, not pasted screenshots.
Charts
NewKeep several live pivots in view and make the output look like the client deck.
What we kept seeing
We've seen the same problem again and again.
A study might start with survey data, move into crosstabs and significance testing, jump out to Excel for tables, into another package for modelling, somewhere else for qualitative coding, and finally into PowerPoint or a dashboard to tell the story.
Every handoff loses something.
The filters change.
The weighting gets recreated.
Qualitative evidence becomes detached from the numbers.
Statistical context disappears into a slide.
And when someone asks a follow-up question, the researcher often has to go back to the beginning.
We thought there should be a better way. So we went back to first principles.
A new generation
Mosaic is a complete new generation of AddMaple, designed around what we've learned from years of working with researchers and analysing thousands of real-world datasets.
We didn't start with the old product and add more features.
We rebuilt the underlying analysis engine, the data model and the research experience around a simple idea:
All the pieces of your research should work together.
Your survey structure should survive import.
Your weights, filters and segments should mean the same thing everywhere.
Your qualitative themes should be analysable alongside your quantitative data.
Your statistical tests should be visible and inspectable.
Your AI should run real analysis rather than guess at answers.
And the work you publish should remain connected to the evidence behind it.
That is why we call it Mosaic.
Mosaic
Mosaic brings together the parts of research that have traditionally lived in separate tools:
All working on the same underlying research.
So you can start with a dataset and immediately understand what's in it. Discover the relationships that matter. Move into deeper statistical or qualitative analysis when the question demands it. Ask AI to investigate alongside you. And turn the findings into something your team or client can continue to explore.
Without constantly exporting, rebuilding and starting again.
One system
For years, research software has been organised around individual tasks.
And increasingly, a separate AI sitting above all of them.
Mosaic takes a different approach.
It starts with the research itself.
One project. One underlying analytical system. Many ways to interrogate it.
Different pieces of evidence, kept connected.
Mosaic in depth
Each page introduces one part of the product from scratch — what it is, what problem it solves, and how to read what it shows you. Every image is the real product on one illustrative concept test.
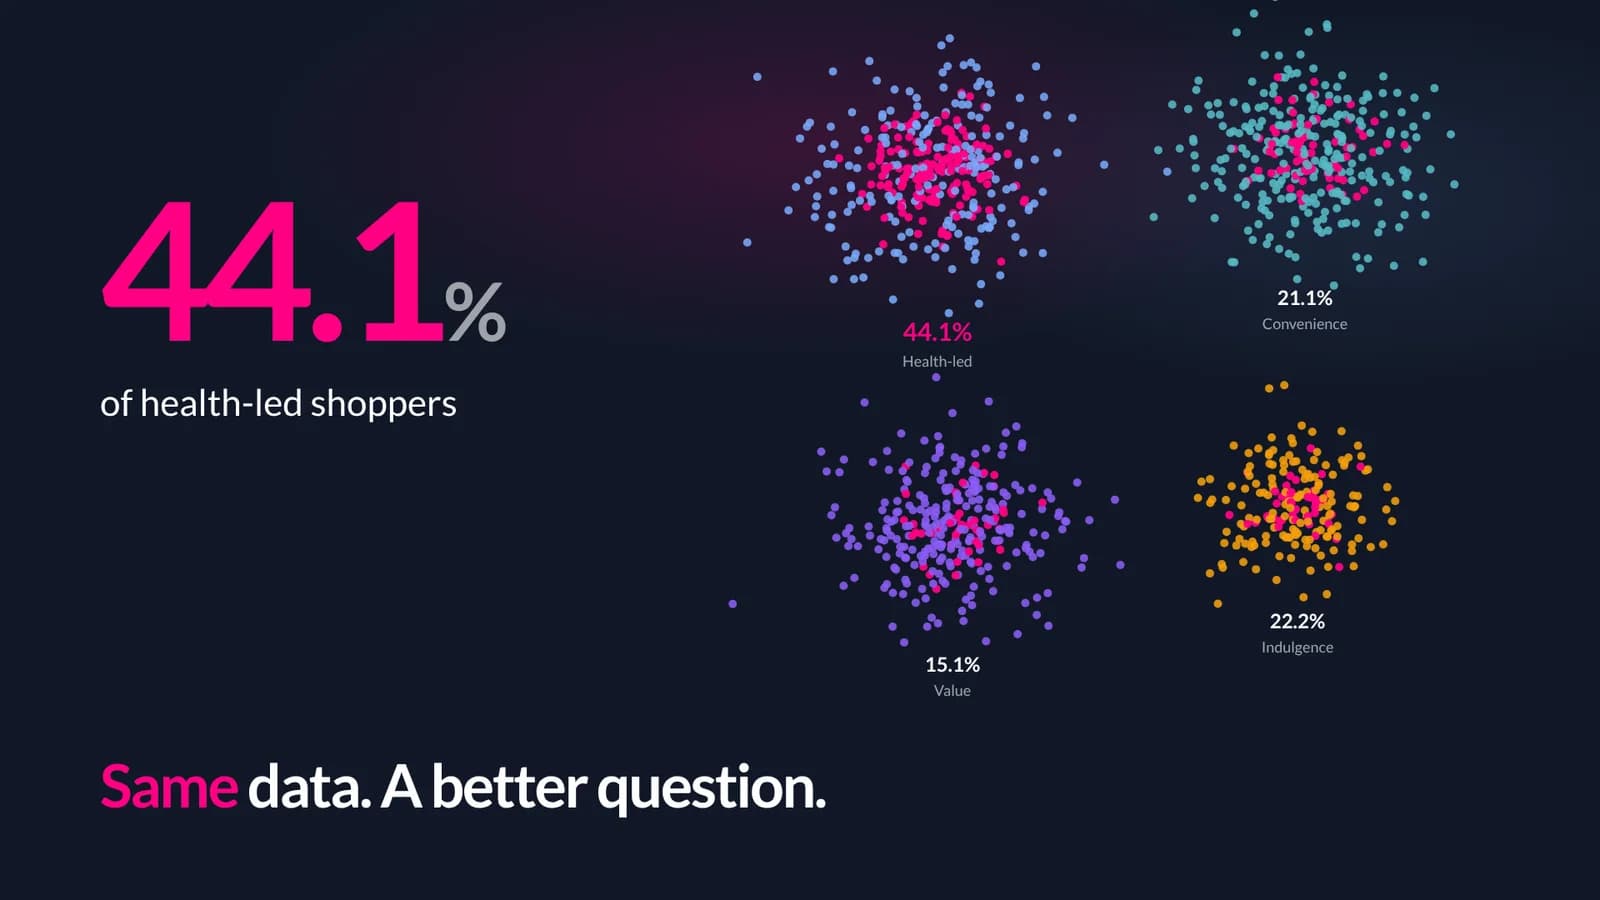
Start here · the field guide
New to the product? What it is, who it is for, and how a study moves through it — clean, tabulate, explain, group, connect, publish.
Read →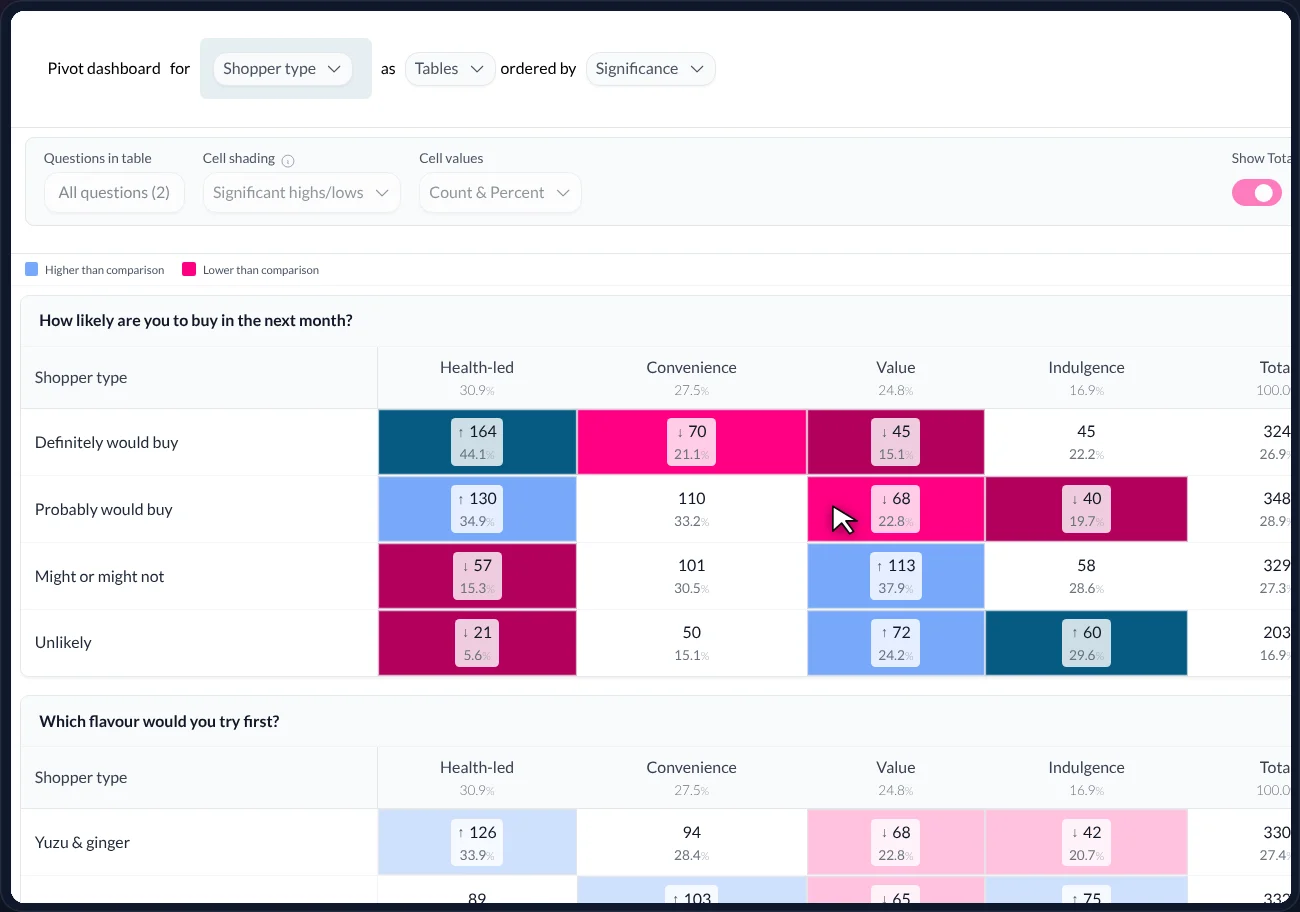
Table Studio
What a banner table is, how to read the shading and the letters, and the Excel workbook explained page by page.
Read →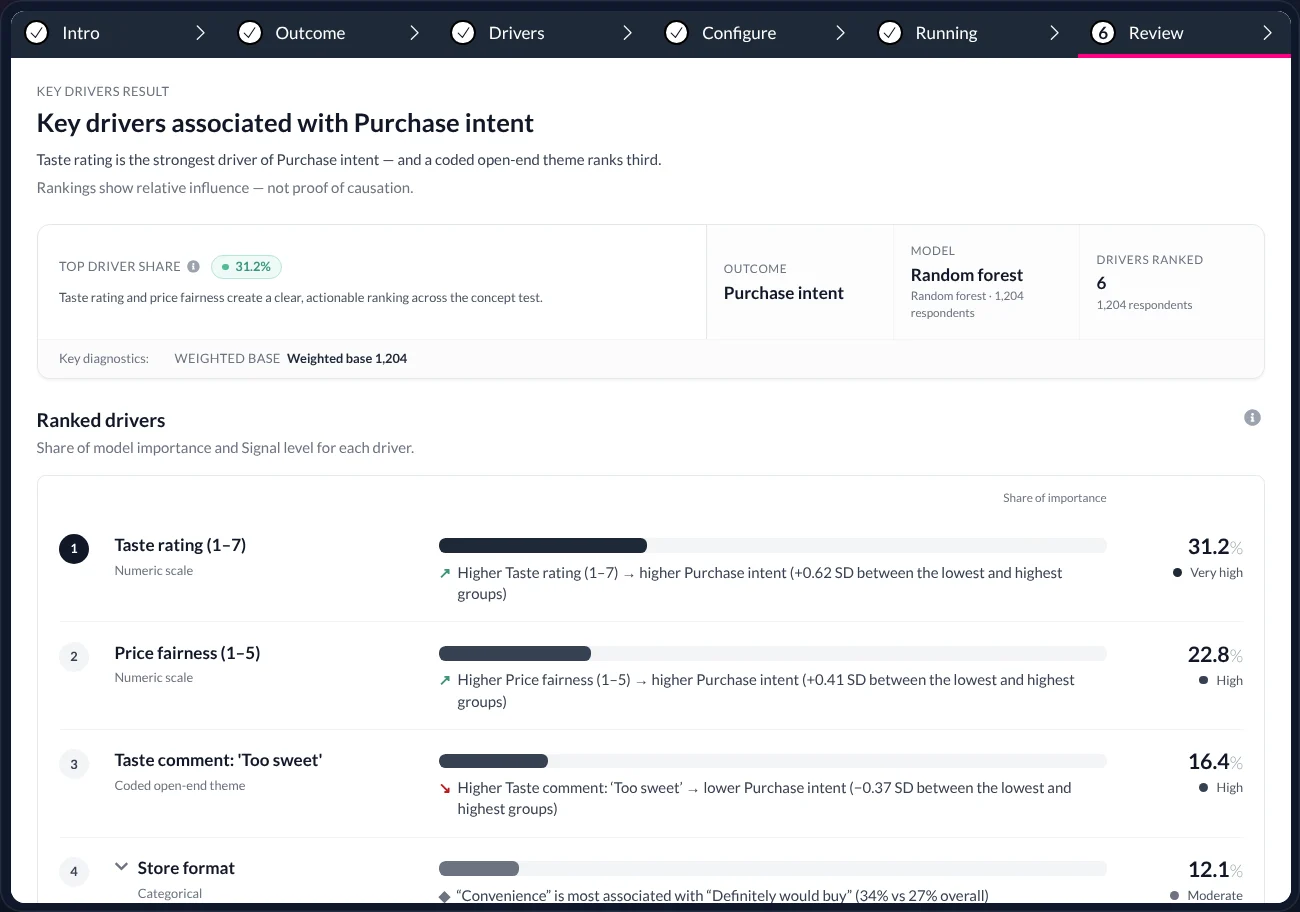
Key drivers
What key driver analysis is, when to use it, and how to read the result screen part by part. Relationships, not causes.
Read →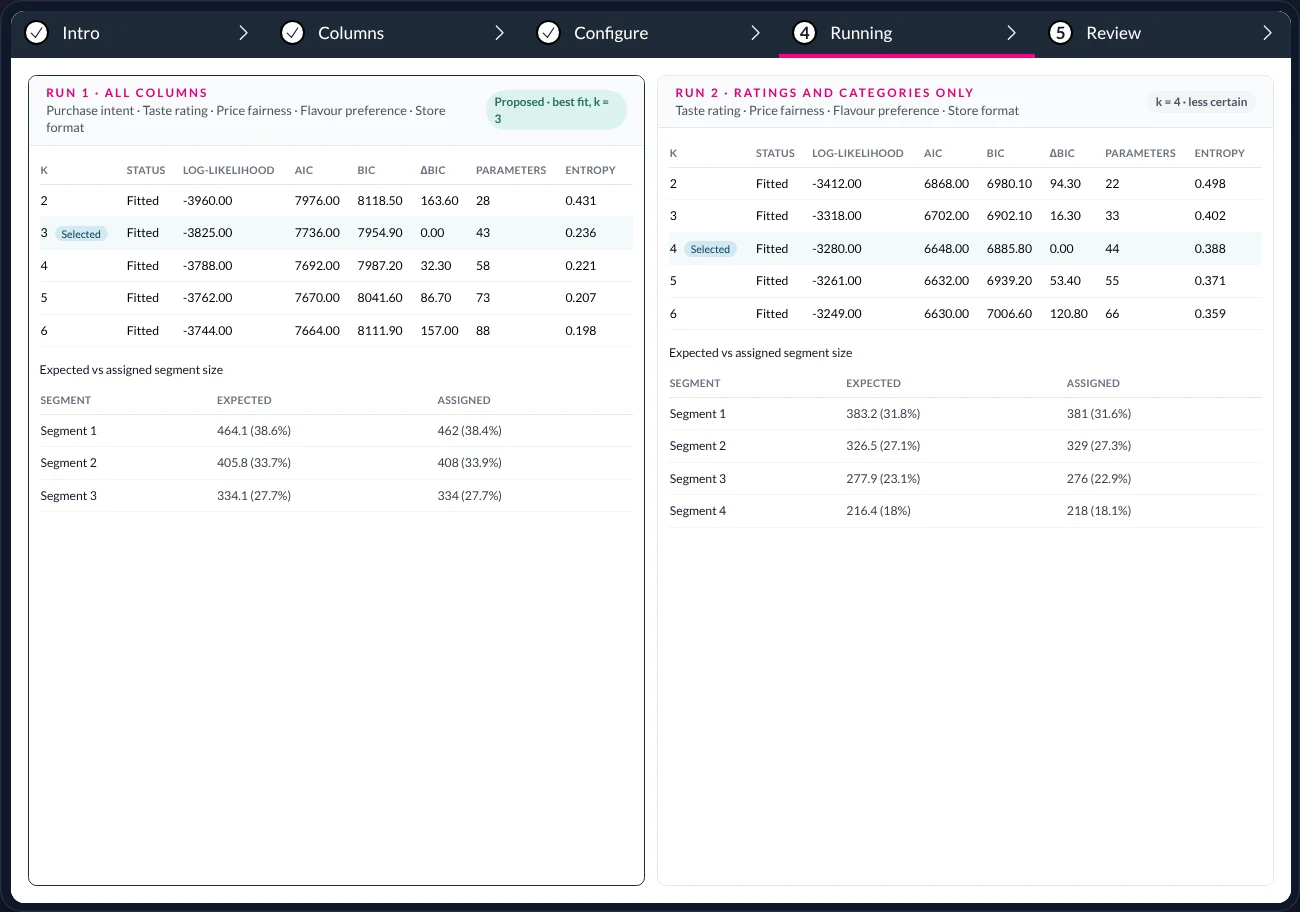
Audience groups
What segmentation is, how AddMaple chooses the method, what BIC and entropy mean, and how to compare two runs.
Read →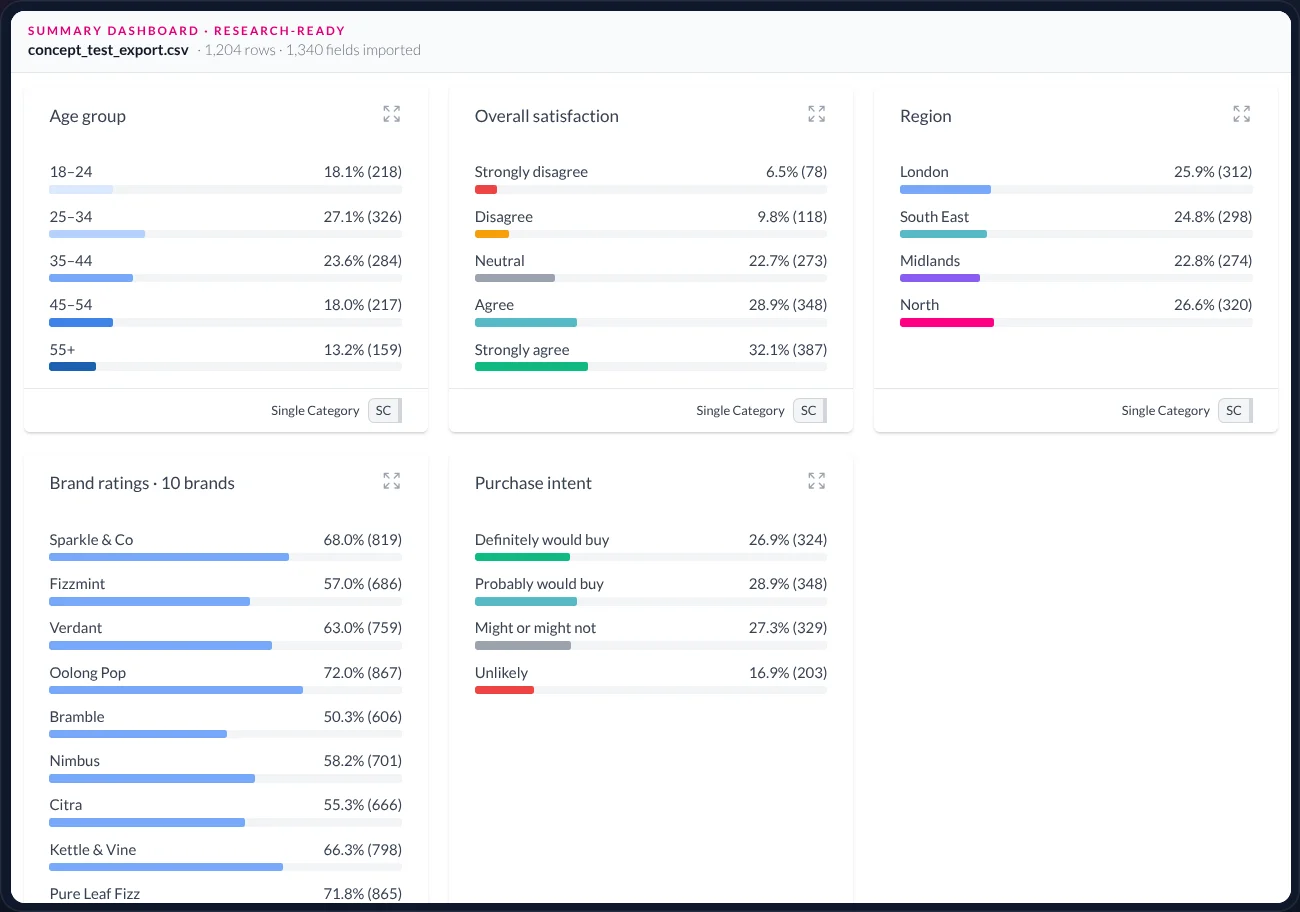
Clean data
What the summary dashboard is, what ‘flagged’ means, how fixes are proposed as a batch — and why the source is never touched.
Read →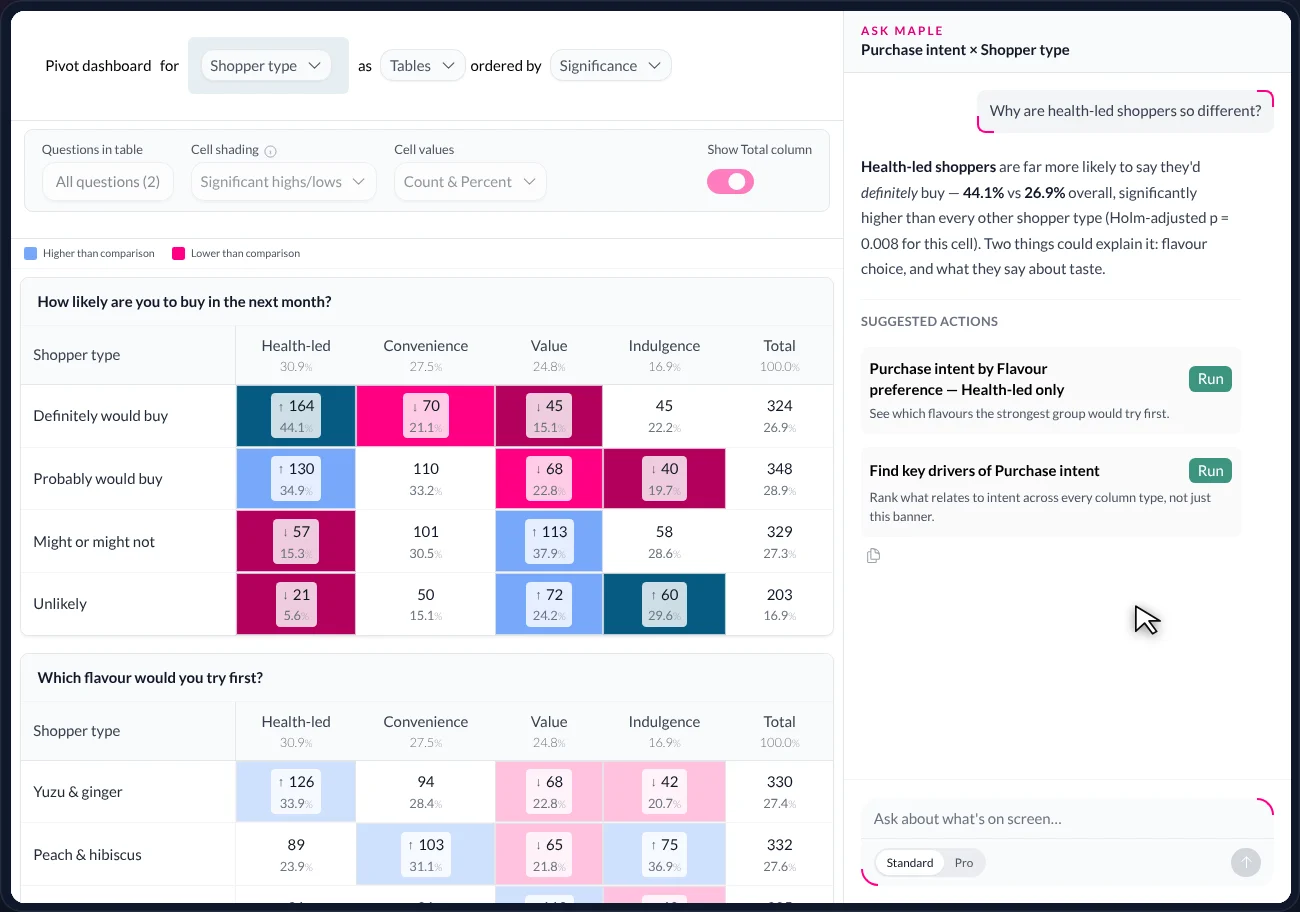
Ask Maple
What the agent can see and do, the panel explained part by part, and one investigation from a question to a draft story.
Read →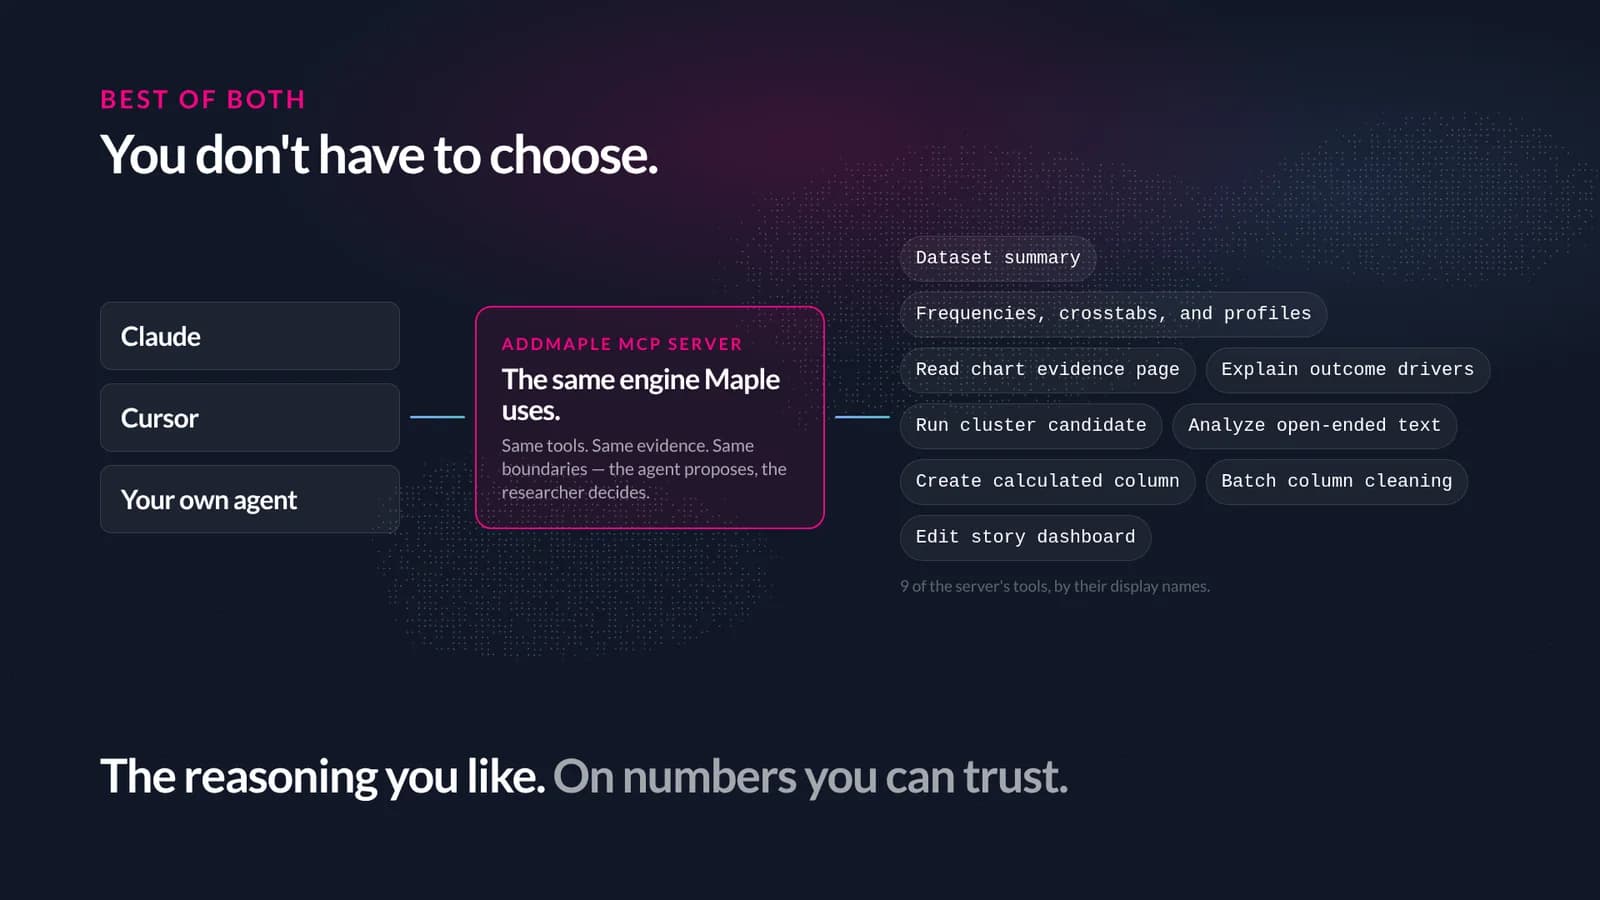
Why AddMaple? · comparison
An honest comparison: numbers computed, not written; evidence you can click; methods that fit survey data — and an MCP server so your assistant can use the same engine.
Read →Under the hood
Ask more of a mixed study: find relationships you didn't plan to test, see what still explains an outcome, and compare groups — with the method chosen for the data.
Reports
A Topline Report for what the study found. A Strategic Report for what it means. Ranked Impact Analysis for what matters most — including what nobody thought to ask.
What did the study find?
A clear first read: headline results, the audience differences that matter, and the evidence behind each finding.
Read this report →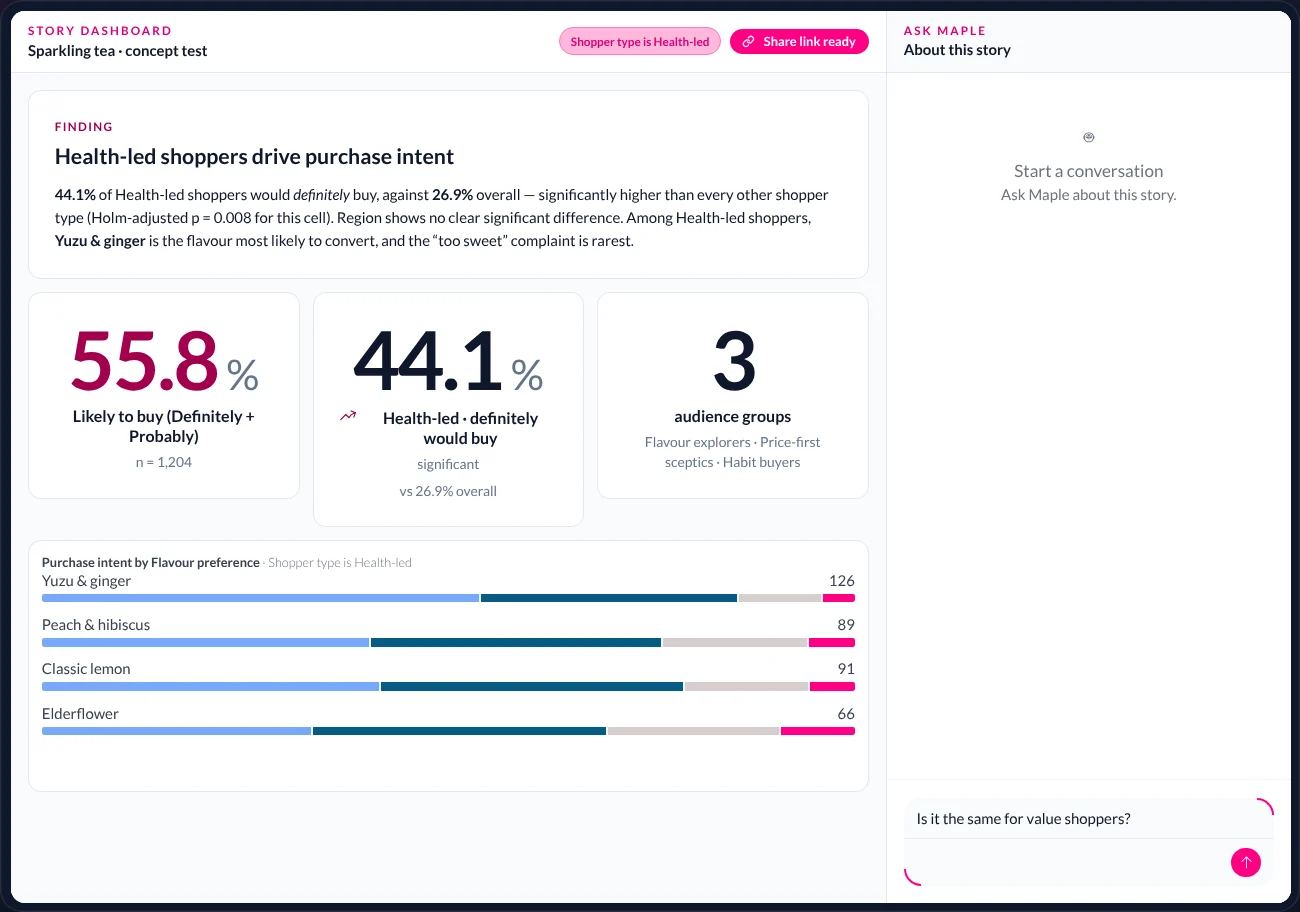
What does it mean, and what should we do?
The evidence pulled into themes, tensions and implications — written for a decision, not a questionnaire.
Read this report →Across the study, what matters most?
A systematic scan of the study, ranked so the strongest differences, relationships and patterns rise first.
Read this report →Story Dashboards
Haven, AI Values, Women’s Freedom and PISA — four stories with the narrative still attached to the evidence. The live dashboards are coming soon.
AddMaple Mosaic
The value of an insight isn't just what it reveals. It's what happens because of it. Book a walkthrough and bring a past study. We'll run it through our statistics engine and show you which areas could have the biggest impact on the business.