


Discover
Relationship discovery
Pick any column and AddMaple automatically runs the right statistical test against every other variable in the project — chi-square, ANOVA, t-tests, Kruskal-Wallis, Pearson and Spearman correlation — ranking thousands of pairwise results by significance and effect size.
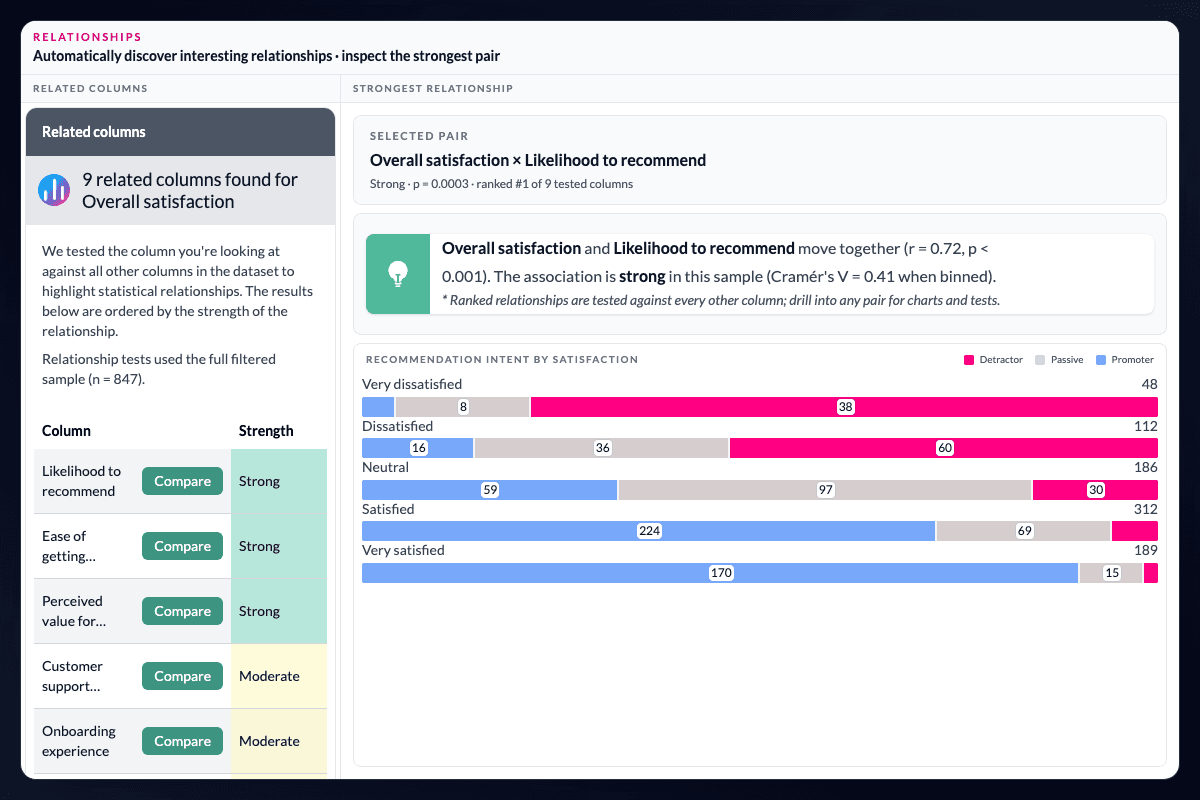
Thousands of statistical tests — without running them yourself.
Most survey projects contain far more variables than a researcher can test by hand. AddMaple's approach is different: select one column and the stats engine compares it against every other column in the project, running the appropriate test for each pair and ranking the results by statistical significance and practical effect size.
On a typical tracker or ad hoc study, that can mean thousands of pairwise tests executed in seconds — chi-square, ANOVA, t-tests, Kruskal-Wallis, Pearson correlation, and Spearman correlation — without exporting to SPSS, writing syntax, or choosing tests one at a time.
The right test is selected from the data in front of you.
You do not pick the test manually. AddMaple inspects column types and routes each comparison automatically:
- Categorical vs categorical — chi-square with Cramér's V
- Numeric vs categorical — ANOVA (3+ groups), t-test (2 groups), or Kruskal-Wallis when groups are small or non-normal, with Cohen's d or eta squared
- Numeric vs numeric — Pearson or Spearman correlation
Weighted projects use weighted versions of these tests so p-values and effect sizes respect your survey weighting scheme.
See what matters first — then inspect the evidence.
Results appear in the Stats tab, colour-coded by strength, with plain-English interpretation. Click a related column to open a pivot chart instantly, or toggle detailed calculations for p-values, effect sizes, sample sizes, and — for chi-square and ANOVA — the categories that differ most.
That is AddMaple's discovery layer: broad, automatic, and inspectable — not a black-box "insights" summary.
Shortlist before you model.
When you pick an outcome for key driver analysis, statistically associated variables surface first as candidate drivers. Relationship discovery answers what is related across the whole codebook; drivers and regression answer what matters most or what is the estimated coefficient — with a defensible starting point rather than an intuition-led search.
For significance shading in banner tables and crosstabs, see statistical testing & significance.
Keep discovery broad without making the conclusion broad.
Relationship discovery is a way to find promising directions, not to claim causation. The analyst decides which relationships are substantively plausible, checks the underlying cuts and bases, and chooses whether the next step is a driver model, regression, or focused table.
Questions teams ask
What does relationship discovery compare?
Related Columns compares a selected variable with other project columns and ranks the results by statistical significance and effect size.
Which tests are used for different variable types?
AddMaple uses chi-square for categorical pairs, ANOVA, t-test, or Kruskal-Wallis for numeric and categorical comparisons, and Pearson or Spearman correlation for numeric pairs.
Does relationship discovery replace driver analysis?
No. It provides a ranked, evidence-backed shortlist of associated variables that can inform a later key-driver model or regression.
Read the evidence in context
Results depend on the study design, data quality, bases, weighting, and method settings. AddMaple calculates the statistical outputs; researchers review practical importance and interpretation. An association is not evidence of causation.
How it works
Step-by-step guides in the AddMaple help center.
- Exploring Related Columns
Start from any variable and see which other columns are statistically related — ranked by strength with named tests chosen for your data types.
- Statistical calculations
How AddMaple's stats engine automatically runs the right test for each column pair — and where to view significance, effect size, and related columns.
Part of AddMaple's feature areas
This capability sits within broader product areas on the features hub.
- Key drivers, regression & relationships
- Tables, banners & significance
Continue exploring
Follow the next step in the workflow or explore a related capability.
- Statistical testing & significanceWhich differences are evidence, not noise? Named tests, effect sizes, and multiple-comparison correction — selected by variable type, with inspectable results.
- Ranked subgroup differencesIn Data Table Studio, surface which questions differ most across a banner first — ranked by statistical strength, including quant variables and AI-coded themes.
- Key driver analysisWhich factors are most strongly associated with an outcome? Rank drivers with target-appropriate models, then inspect the evidence before it becomes a recommendation.
- Regression, PCA & multivariate modellingWhat is the estimated relationship — and what structure sits behind the batteries? Linear and logistic regression with fitted charts, Elastic Net multivariate key-driver models, and PCA with optional Varimax rotation.
See this capability on a real research workflow.
Bring one study or delivery workflow and we’ll show where AddMaple fits.